August 21, 2025
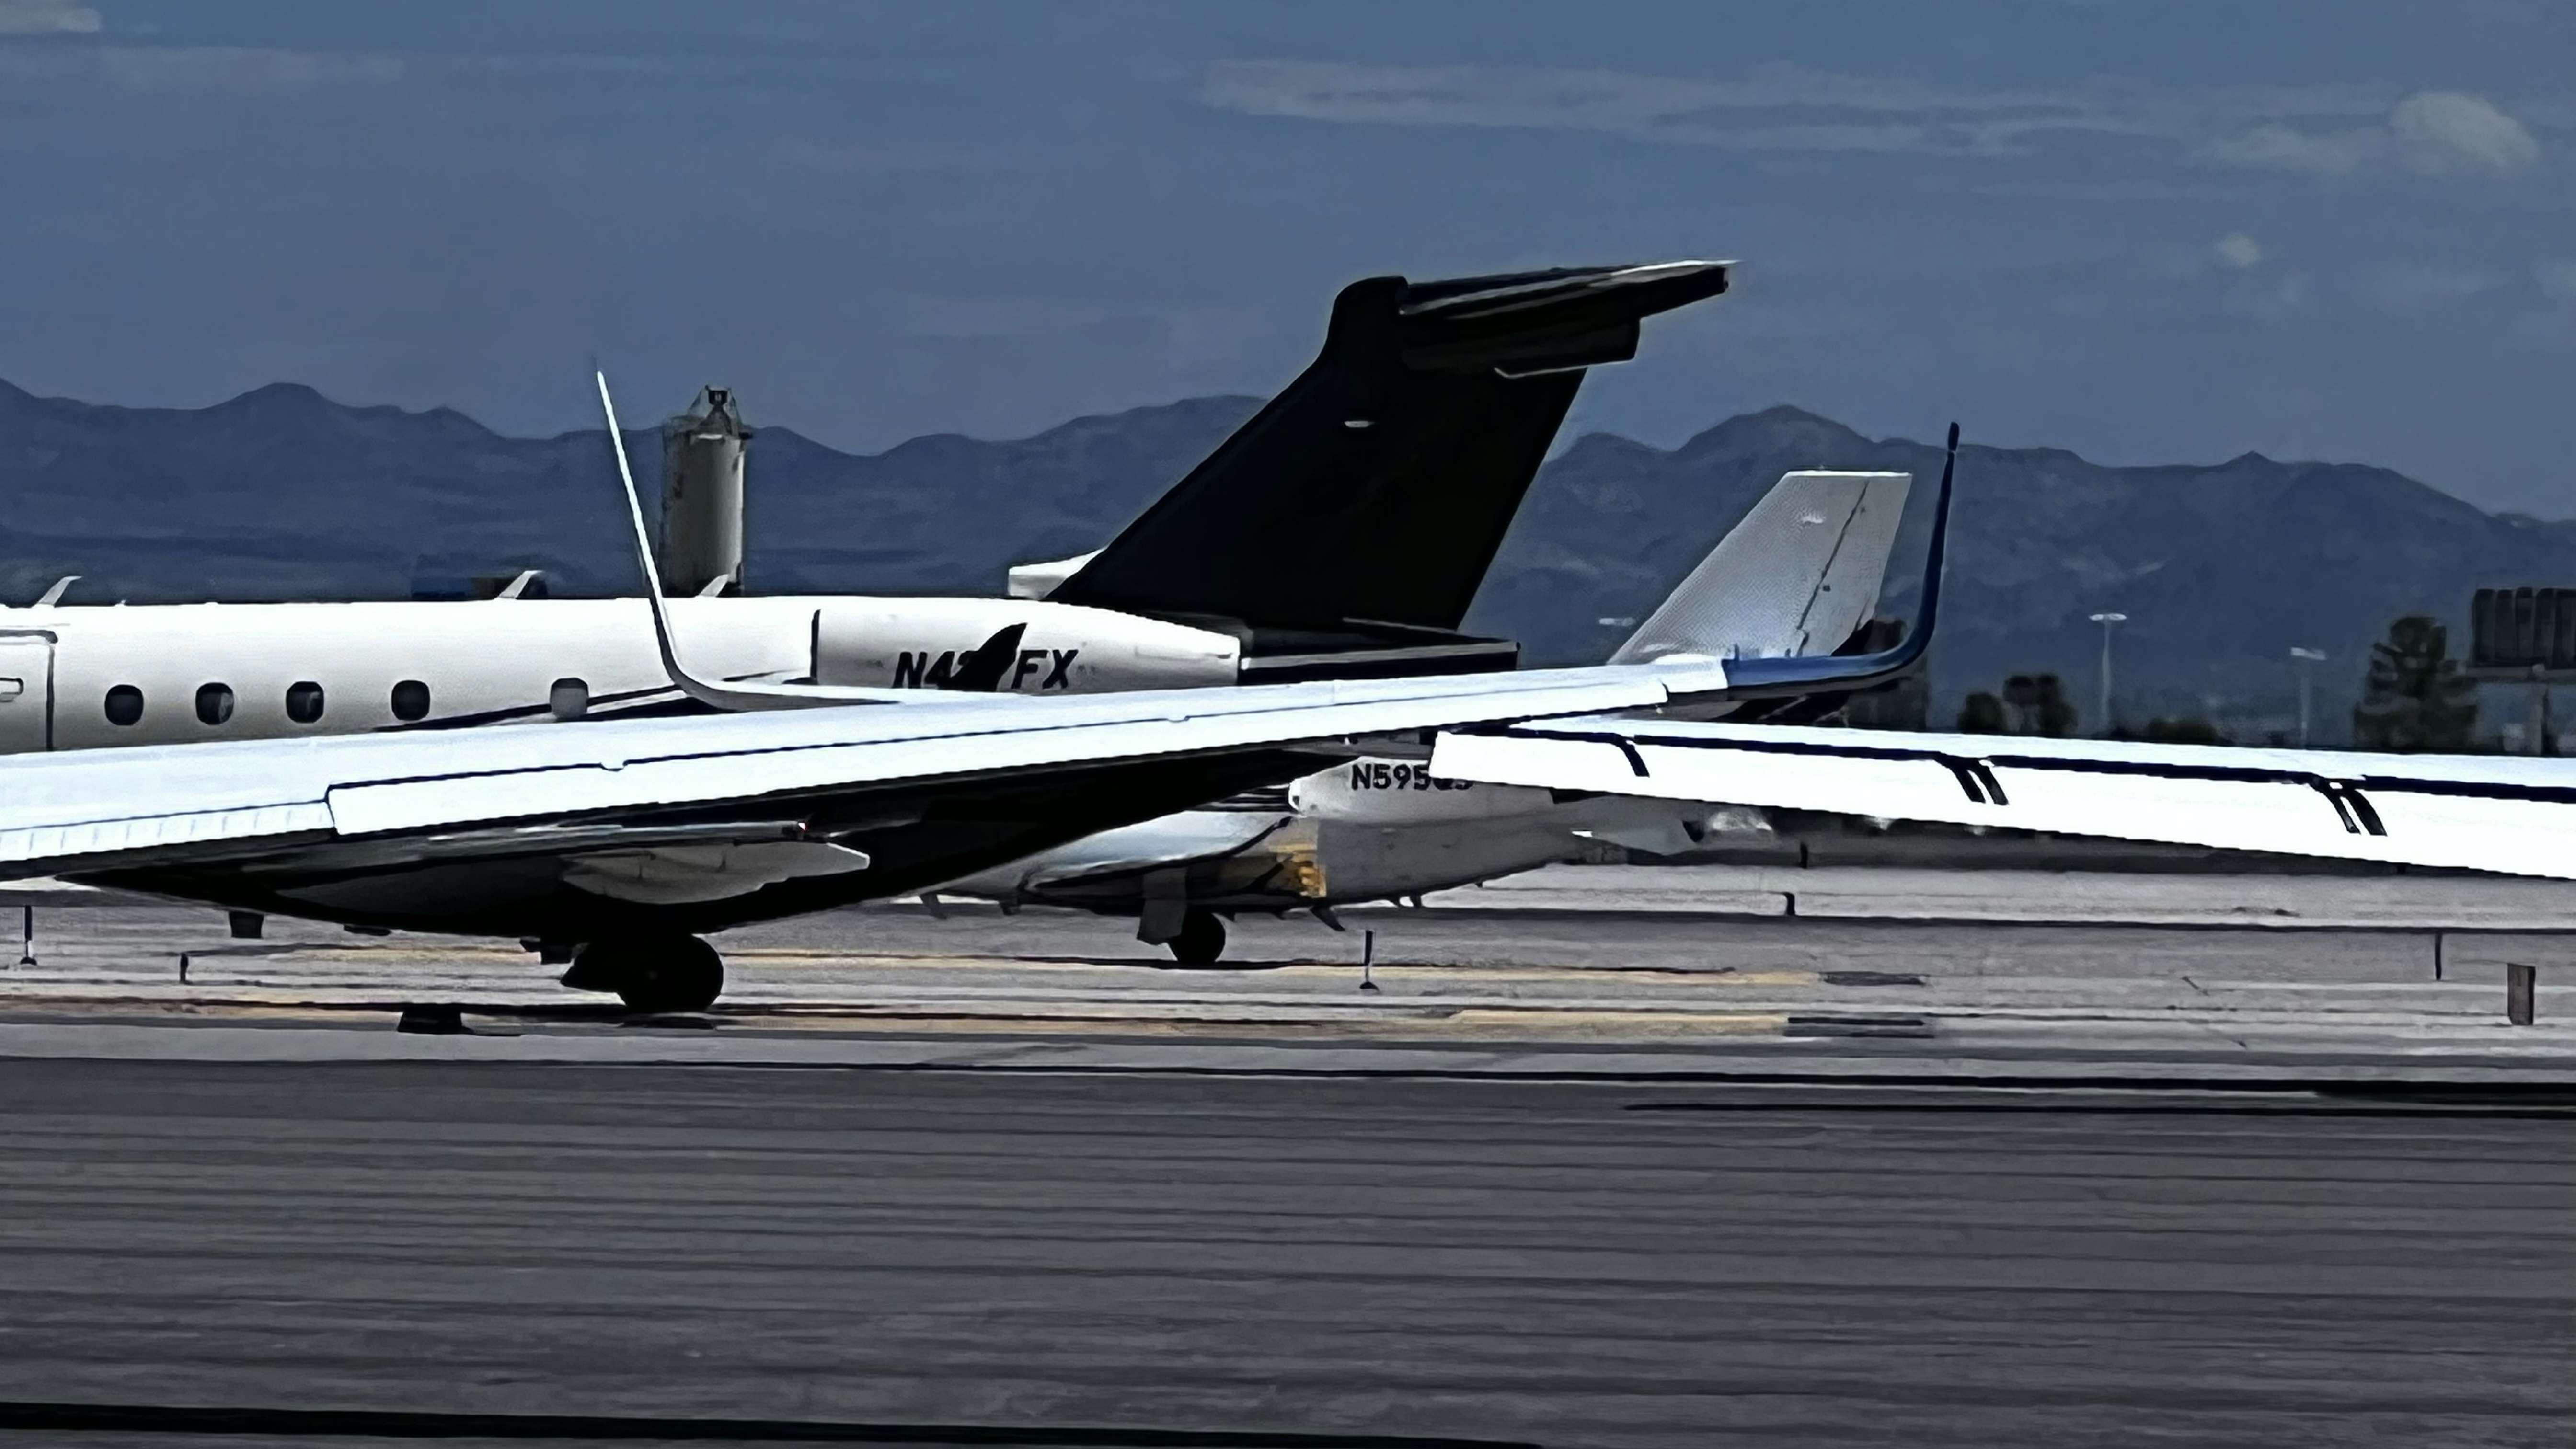
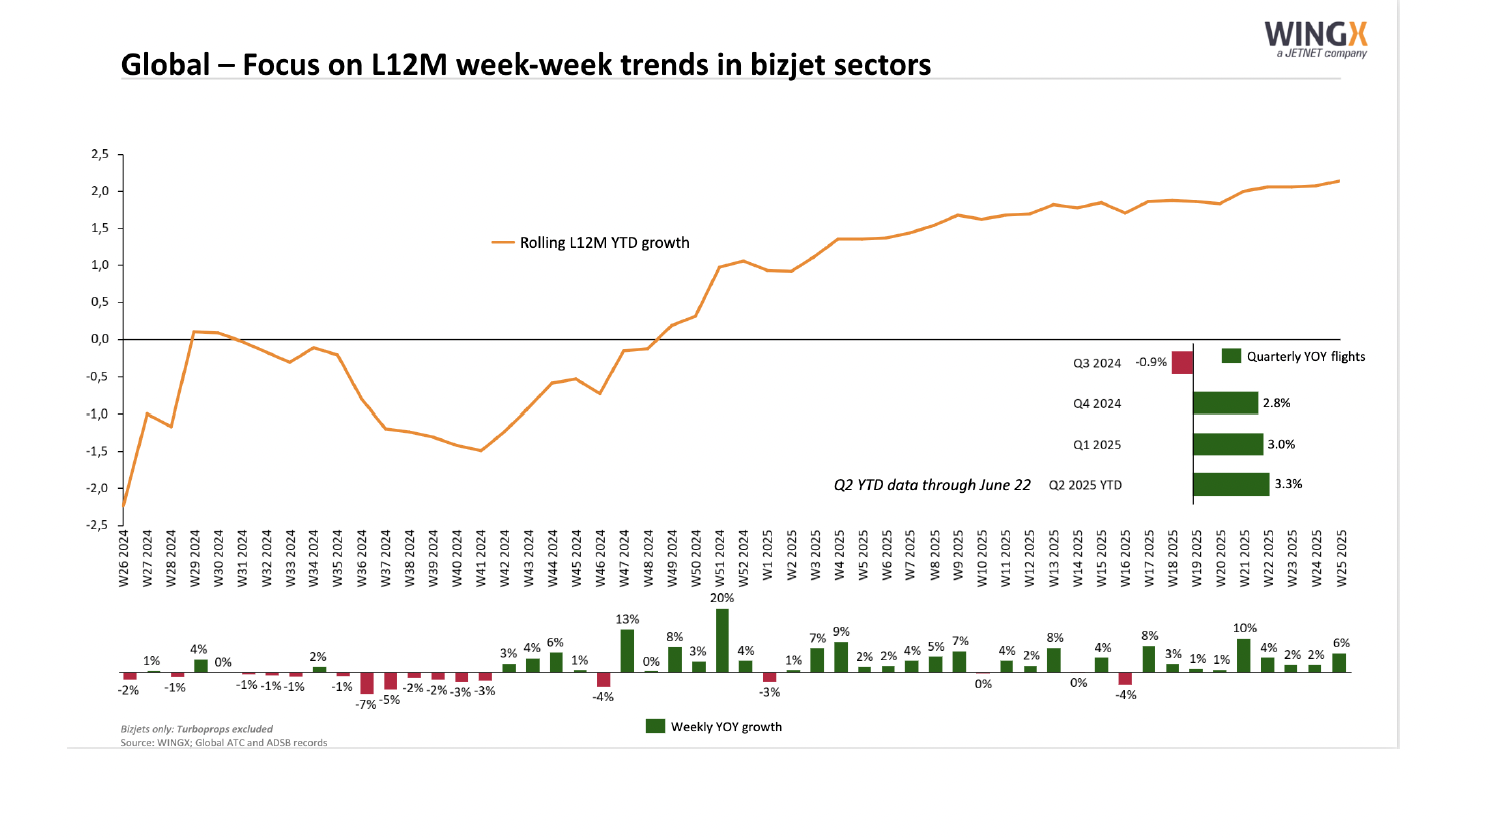
Private jet flight activity continued to flex its muscles with a 1% YOY gain in Week 5 staying 4% ahead of last year over the past month.

Worldwide private jet flight activity (64,940 segments) dipped 3% sequentially in Week 5.
That still left the numbers for the week ending Feb. 2, 2025 1% ahead of 2024.
For the trailing four weeks, global private jet departures tracked 4% ahead of where they were a year ago.
“Economic concerns are up this week after Trump’s trade war declaration,” says WingX Managing Director Richard Koe.
However, he adds, “This will certainly worry business jet OEMs outside the U.S., although, as a proportion of total activity, international flights to and from the U.S. are a tiny part.”
Koe continues, “And flight demand is still seeing the positive effects of the Trump bump, with fractional demand particularly strong, endorsing Flexjet’s bumper billion-dollar new aircraft order this week.”
Per WingX, Flexjet departures grew 125.3% comparing 2024 versus 2019.
Its flight hours over the five years flexed upwards by 129.9%, while its fleet grew by 77.6%.
Flexjet CEO Mike Silvestro tells Private Jet Card Comparisons, “‘I’m as bullish on private aviation, fractional ownership, and Flexjet as I have ever been.”
He has been in the business since 2000.
His response was to my questioning if the bloom was off the rose.
After all, charter and Part 91 flying has been down in 2023 and 2024 since its peak in 2022.
Fractional hours increased 6.2% last year, but the charter was the first to dip before the Great Recession.
Despite the big order, what were his feelings about the market, I had asked?
“If you look at the metrics year-over-year, the Part 135 market is perhaps a little soft but on top of an incredible post-pandemic rush. We have to keep our wits about us to what we are comparing,” he says.
READ: Private Jet Flights Hours Recap 2007 to 2024
For the week, U.S. private jet departures (44,746) also increased 1% year over year despite a 4% week-to-week drop.
U.S. private jet departures were up 6% year-over-year for the trailing four weeks.
Europe (8,393 segments) was down 3% from the previous week but still 4% higher than last year.
European private jet departures during the trailing four weeks showed a 1% gain.
| Market | Week 5 | %Change vs. prior week | %Change vs W5 2024 | 52-week high | Week | 52-week low | Week | Last 4 Weeks (Flights) | %Change vs YOY |
| Global | 64,940 | -3% | 1% | 76,527 | 2024-26 | 59,330 | 2025-02 | 255,749 | 4% |
| North America | 46,080 | -4% | 1% | 55,963 | 2024-42 | 39,430 | 2024-27 | 182,433 | 6% |
| USA | 44,746 | -4% | 1% | 54,305 | 2024-42 | 37,852 | 2024-27 | 177,455 | 6% |
| Florida | 7,229 | -3% | 1% | 8,741 | 2024-08 | 4,030 | 2024-32 | 28,676 | 4% |
| California | 4,202 | -3% | -3% | 5,214 | 2024-43 | 3,472 | 2024-27 | 17,315 | -1% |
| Texas | 4,741 | 5% | 6% | 5,846 | 2024-42 | 3,554 | 2024-27 | 18,335 | 3% |
| Europe | 8,393 | -3% | 4% | 15,188 | 2024-26 | 6,291 | 2025-01 | 31,367 | 1% |
| UK | 1,199 | 2% | 7% | 2,105 | 2024-28 | 1,003 | 2024-52 | 4,431 | 2% |
| Germany | 1,051 | -6% | -7% | 1,736 | 2024-25 | 548 | 2025-01 | 3,970 | -5% |
| France | 1,345 | -8% | 10% | 2,638 | 2024-30 | 1,033 | 2024-52 | 5,049 | 7% |
| Switzerland | 764 | -26% | 6% | 1,034 | 2025-04 | 526 | 2024-47 | 3,238 | 1% |
| Italy | 772 | 2% | 3% | 2,167 | 2024-29 | 514 | 2025-01 | 2,766 | 1% |
| Middle East | 1,368 | 8% | 9% | 1,663 | 2024-24 | 1,013 | 2024-14 | 5,370 | 0% |
| Africa | 783 | 7% | 6% | 883 | 2024-21 | 588 | 2024-36 | 3,079 | -7% |
| Asia | 1,999 | -7% | -2% | 2,443 | 2024-46 | 1,820 | 2024-25 | 8,519 | -1% |
| South America | 2,102 | 7% | 2% | 2,573 | 2024-51 | 1,649 | 2024-07 | 8,048 | 8% |
Source: WingX for Private Jet Card Comparisons. Includes Jets and VIP Airliners.
Fractional and charter operators saw a 6% week-to-week drop, with 32,397 departures.
That was still 5% up year-over-year.
And over the past four weeks, departures were 8% in the black year-over-year.
| Market (Part 91K & Part135) | Week 5 | %Change vs prior wk | %Change vs W5 2024 | 52-week high | Week | 52-week low | Week | Last 4 Weeks (Flights) | %Change vs YOY |
| Global | 32,397 | -6% | 5% | 41,434 | 2024-29 | 30,536 | 2025-02 | 129,587 | 8% |
| North America | 24,422 | -7% | 5% | 30,594 | 2024-42 | 22,715 | 2024-27 | 98,880 | 10% |
| USA | 23,985 | -8% | 5% | 29,954 | 2024-42 | 22,064 | 2024-27 | 97,135 | 10% |
| Florida | 4,282 | -3% | 4% | 5,436 | 2025-01 | 2,148 | 2024-35 | 16,977 | 8% |
| California | 2,626 | -7% | -4% | 3,432 | 2024-43 | 2,397 | 2024-27 | 11,314 | 3% |
| Texas | 2,093 | -3% | 12% | 2,813 | 2024-42 | 1,627 | 2024-27 | 8,339 | 8% |
| Europe | 5,593 | 0% | 4% | 11,097 | 2024-26 | 4,576 | 2025-02 | 20,749 | 0% |
| UK | 819 | 6% | 2% | 1,612 | 2024-28 | 692 | 2025-03 | 3,004 | -1% |
| Germany | 651 | -8% | -9% | 1,258 | 2024-25 | 413 | 2025-01 | 2,517 | -6% |
| France | 866 | -2% | 6% | 1,937 | 2024-30 | 728 | 2025-03 | 3,231 | 3% |
| Switzerland | 552 | -21% | 3% | 778 | 2024-07 | 379 | 2024-47 | 2,303 | -1% |
| Italy | 595 | 14% | 15% | 1,717 | 2024-29 | 375 | 2025-01 | 2,025 | 3% |
| Middle East | 676 | 8% | 7% | 1,043 | 2024-31 | 567 | 2024-13 | 2,654 | 5% |
| Africa | 270 | 30% | 45% | 305 | 2024-52 | 163 | 2024-12 | 958 | 10% |
| Asia | 282 | 4% | 17% | 392 | 2024-46 | 230 | 2024-25 | 1,141 | 7% |
| South America | 40 | -18% | -9% | 59 | 2024-34 | 18 | 2024-20 | 185 | -5% |
Source: WingX for Private Jet Card Comparisons. Includes Jets and VIP Airliners.
The 23,985 U.S. fractional and charter departures marked a 5% year-over-year increase despite an 8% sequential dip.
The U.S. market saw a 10% increase during the trailing four weeks.
In Europe, a 4% year-over-year gain kept activity flat week-to-week and over the following four weeks.


Find the perfect solution for your private aviation needs
Save Time. Buy Confidently.
Receive an apples-to-apples comparison of programs that meet your needs from more than 500 jet card and fractional options covering 65 points of differentiation and over 40,000 data points.