November 20, 2025
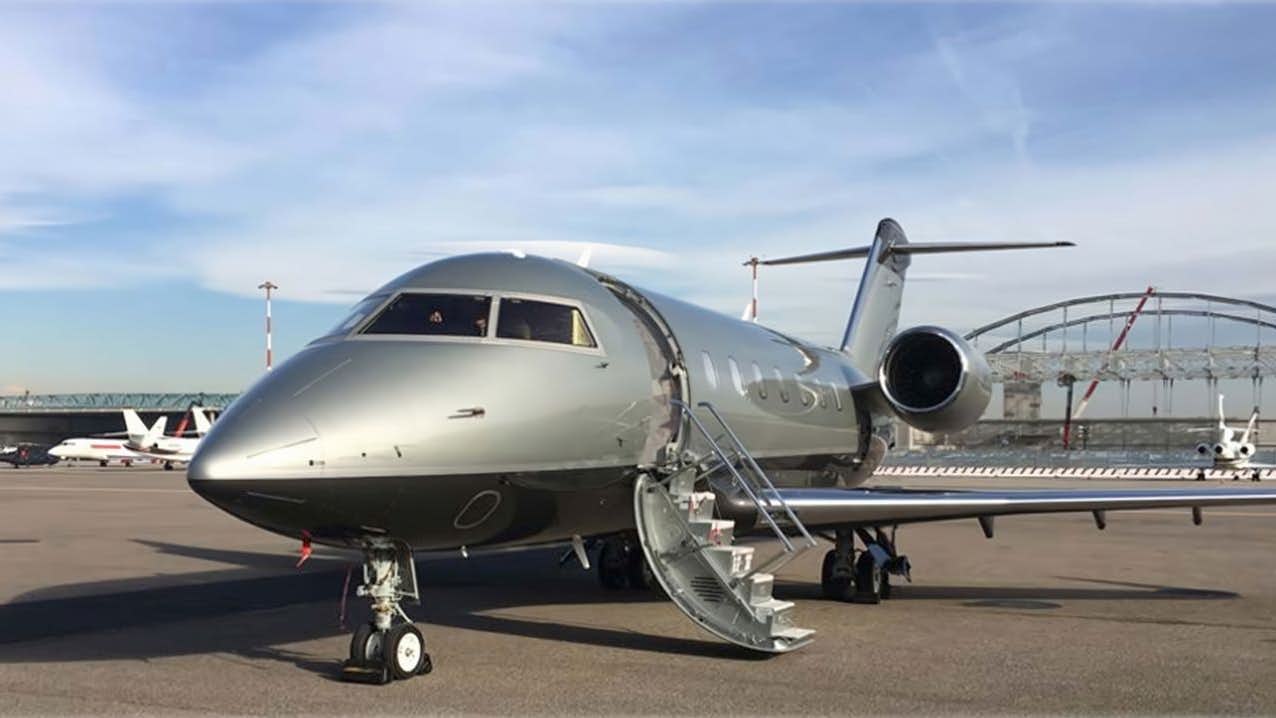
U.S. charter and fractional private jet flight activity jumps 8% year-over-year as business aviation continues its strong 2025 start.

Fractional and charter operators in the U.S. helped power worldwide private jet flight activity for Week 11, which gained 4% to 76,677 segments year-over-year.
That was a 2% sequential gain from the previous week.
Over the past four weeks, private jet flight activity (294,940 segments) was 4% ahead of 2024 numbers.
It’s also worth remembering this week marked the beginning of the beginning in private aviation’s surge to record demand amid Covid shutdowns.
It’s also worth remembering that it got really bad for those in the industry before the surge.
The pain started this week five years ago.

Back to the present, after a one-week blip of red numbers, private jet travel continued its year-over-year growth at numbers near those 2022 record levels.
WingX Managing Director Richard Koe says, “Global business jet activity rebounded after last week’s relapse, with flight demand in the U.S. belying broader economic concerns.”
He notes, “Business jet departures were up 17% in Texas compared to last year.”
Looking back to Covid, Koe adds, “This week’s business jet activity is up by 28% in the U.S. and 3% in Europe compared to the same week in 2020 when lockdowns started to be imposed.”
| Market | Week 11 | %Change vs. prior week | %Change vs. W11 2024 | 52-week high | Week | 52-week low | Week | Last 4 Weeks (Flights) | %Change vs. YOY |
| Global | 73,503 | 2% | 4% | 77,677 | 2024-42 | 60,521 | 2025-02 | 294,940 | 4% |
| North America | 52,392 | 1% | 5% | 56,586 | 2024-42 | 39,856 | 2024-27 | 210,568 | 4% |
| USA | 50,915 | 1% | 5% | 54,858 | 2024-42 | 38,205 | 2024-27 | 204,556 | 4% |
| Florida | 8,475 | 0% | 0% | 9,230 | 2025-08 | 4,074 | 2024-32 | 34,518 | 4% |
| California | 4,748 | -5% | -2% | 5,262 | 2024-43 | 3,494 | 2024-27 | 19,356 | 2% |
| Texas | 5,559 | 2% | 17% | 5,915 | 2024-42 | 3,597 | 2024-27 | 21,618 | 7% |
| Europe | 8,887 | 6% | -4% | 15,215 | 2024-26 | 6,313 | 2025-01 | 34,767 | -2% |
| UK | 1,307 | 7% | -4% | 2,109 | 2024-28 | 1,005 | 2024-52 | 5,068 | 0% |
| Germany | 1,026 | 0% | -16% | 1,743 | 2024-25 | 549 | 2025-01 | 4,094 | -13% |
| France | 1,447 | 8% | -1% | 2,645 | 2024-30 | 1,040 | 2024-52 | 5,490 | -1% |
| Switzerland | 711 | -10% | -10% | 1,036 | 2025-04 | 526 | 2024-47 | 3,337 | 5% |
| Italy | 829 | 12% | -9% | 2,171 | 2024-29 | 516 | 2025-01 | 3,208 | -2% |
| Middle East | 1,281 | 11% | 21% | 1,692 | 2024-24 | 1,042 | 2024-14 | 5,393 | -2% |
| Africa | 794 | -14% | 19% | 996 | 2025-08 | 603 | 2024-36 | 3,691 | 22% |
| Asia | 2,189 | -10% | 0% | 2,587 | 2025-09 | 1,948 | 2024-25 | 9,780 | 3% |
| South America | 2,558 | 15% | 21% | 2,855 | 2025-09 | 1,801 | 2025-01 | 9,895 | 17% |
Source: WingX for Private Jet Card Comparisons. Includes Jets and VIP Airliners.
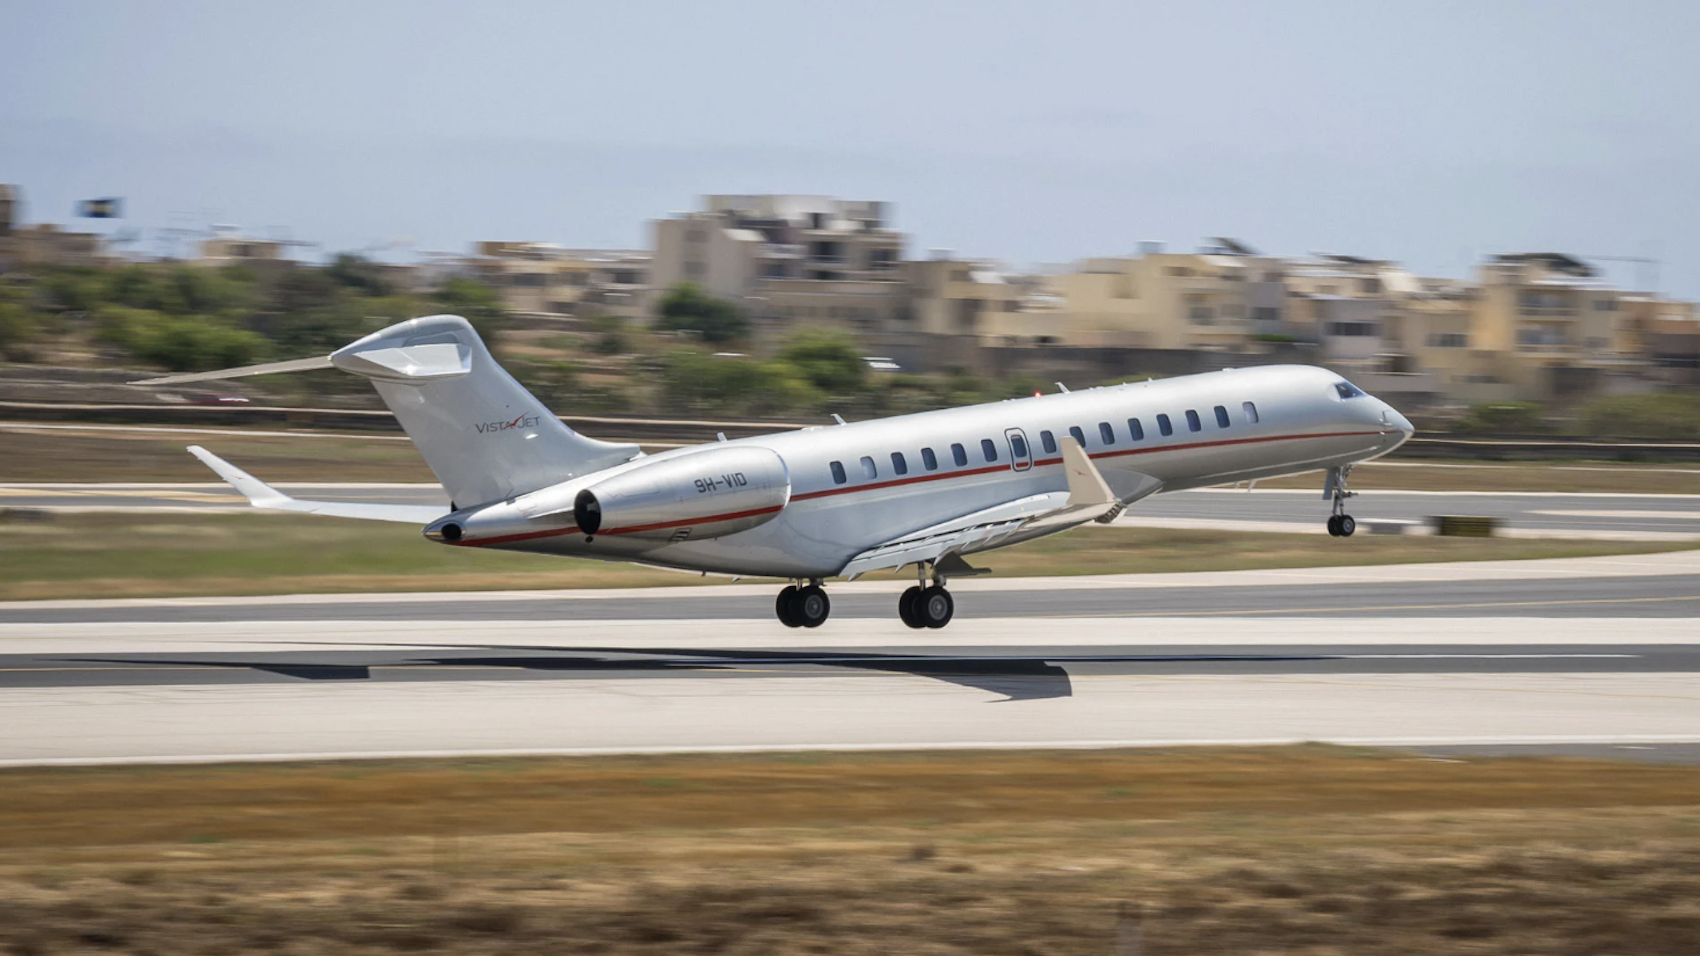
Worldwide private jet fractional and charter flights (37,040) increased 5% year-over-year and 3% week-to-week.
The week ended March 16, 2025, represented a 5% gain year-over-year during the past four weeks.
U.S. fractional and charter operators flew 27,709 segments, a 1% sequential gain and an 8% year-over-year jump.
During the past four weeks, they were 7% ahead of 2024.
| Market (Part 91K & Part135) | Week 11 | %Change vs. prior wk | %Change vs W11 2024 | 52-week high | Week | 52-week low | Week | Last 4 Weeks (Flights) | %Change vs YOY |
| Global | 37,040 | 3% | 5% | 41,902 | 2024-29 | 31,002 | 2025-02 | 147,873 | 5% |
| North America | 28,205 | 1% | 8% | 30,966 | 2024-42 | 23,013 | 2024-27 | 113,360 | 7% |
| USA | 27,709 | 1% | 8% | 30,299 | 2024-42 | 22,333 | 2024-27 | 111,272 | 7% |
| Florida | 5,006 | 3% | 3% | 5,501 | 2025-01 | 2,180 | 2024-35 | 20,153 | 6% |
| California | 3,090 | -5% | -2% | 3,483 | 2024-43 | 2,430 | 2024-27 | 12,601 | 4% |
| Texas | 2,553 | 4% | 17% | 2,845 | 2024-42 | 1,653 | 2024-27 | 9,860 | 14% |
| Europe | 5,992 | 5% | -8% | 11,117 | 2024-26 | 4,588 | 2025-02 | 23,494 | -5% |
| UK | 909 | 9% | -6% | 1,616 | 2024-28 | 692 | 2025-03 | 3,509 | -3% |
| Germany | 648 | 3% | -20% | 1,263 | 2024-25 | 414 | 2025-01 | 2,478 | -19% |
| France | 977 | 7% | -4% | 1,939 | 2024-30 | 729 | 2025-03 | 3,642 | -6% |
| Switzerland | 528 | -12% | -15% | 785 | 2025-08 | 379 | 2024-47 | 2,541 | 2% |
| Italy | 587 | 8% | -12% | 1,722 | 2024-29 | 377 | 2025-01 | 2,325 | -4% |
| Middle East | 588 | 17% | 0% | 1,047 | 2024-31 | 503 | 2025-10 | 2,487 | -15% |
| Africa | 193 | -5% | 8% | 312 | 2024-52 | 169 | 2024-12 | 938 | 16% |
| Asia | 288 | 5% | 6% | 412 | 2024-46 | 228 | 2025-06 | 1,218 | 10% |
| South America | 82 | 67% | 78% | 82 | 2025-11 | 16 | 2024-23 | 230 | 24% |
Source: WingX for Private Jet Card Comparisons. Includes Jets and VIP Airliners.
Europe, however, was not in such good shape.
Its 5,992 segments were down 8% from last year.
Over the past four weeks, European charter and fractional flying have been down by 5%.


Find the perfect solution for your private aviation needs
Save Time. Buy Confidently.
Receive an apples-to-apples comparison of programs that meet your needs from more than 500 jet card and fractional options covering 65 points of differentiation and over 40,000 data points.