August 21, 2025
A 7% year-over-year increase in U.S. private jet segments helped drive global private jet flight activity up 5% to start 2025’s second half.

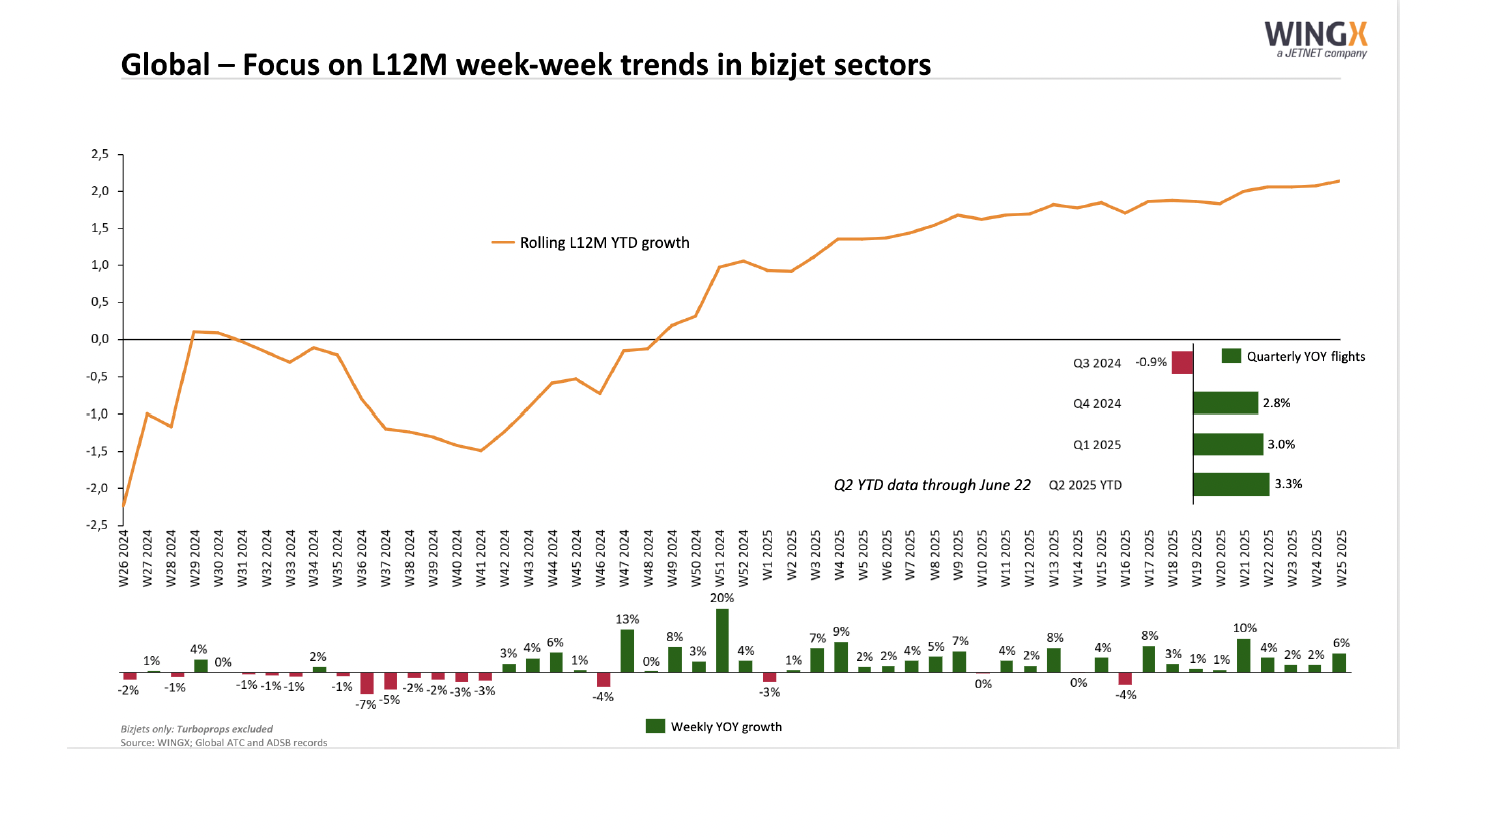
Worldwide private jet flight activity started the second half of 2025 the way it ended the first half, according to the latest weekly update from WingX.
Private jet departures globally (67,693) were up 5% year-over-year.
If you prefer to look at the glass as less than half full, note this week’s numbers are 14% down sequentially from last week.
Last week set a 52-week high for the second straight week.
For 2025, the industry has posted gains in 23 of 27 week, with two weeks of flat growth and only two down weeks, including the first week of the year.
U.S. private jet segments (40,714) were up 7% compared to 2024 in Week 27.
Europe (15,370 segments) contributed a 5% year-over-year gain to 2025’s totals.
| Market | Week 27 | %Change vs. prior week | % Change vs. W27 2024 | 52-week high | Week | 52-week low | Week | Last 4 Weeks (Flights) | %Change vs YOY |
| Global | 67,693 | -14% | 5% | 78,808 | 2025-26 | 60,521 | 2025-02 | 300,095 | 4% |
| North America | 42,332 | -21% | 6% | 56,587 | 2024-42 | 42,332 | 2025-27 | 200,015 | 5% |
| USA | 40,714 | -21% | 7% | 54,859 | 2024-42 | 40,714 | 2025-27 | 192,308 | 5% |
| Florida | 4,389 | -14% | 4% | 9,230 | 2025-08 | 4,074 | 2024-32 | 19,883 | 6% |
| California | 3,726 | -17% | 7% | 5,285 | 2025-17 | 3,726 | 2025-27 | 17,017 | 5% |
| Texas | 3,885 | -23% | 8% | 5,915 | 2024-42 | 3,885 | 2025-27 | 18,329 | 7% |
| Europe | 15,370 | 0% | 5% | 15,370 | 2025-27 | 6,313 | 2025-01 | 59,373 | 1% |
| UK | 2,088 | 7% | 5% | 2,109 | 2024-28 | 1,005 | 2024-52 | 7,802 | 0% |
| Germany | 1,382 | -7% | -10% | 1,650 | 2024-28 | 549 | 2025-01 | 5,356 | -19% |
| France | 2,352 | -4% | -1% | 2,755 | 2025-25 | 1,040 | 2024-52 | 10,048 | 2% |
| Switzerland | 887 | -1% | 10% | 1,036 | 2025-04 | 526 | 2024-47 | 3,429 | 0% |
| Italy | 2,464 | 0% | 16% | 2,476 | 2025-26 | 516 | 2025-01 | 9,163 | 18% |
| Middle East | 1,516 | 5% | 1% | 1,776 | 2025-20 | 1,159 | 2025-10 | 6,131 | 2% |
| Africa | 856 | 0% | 1% | 1,047 | 2025-17 | 603 | 2024-36 | 3,364 | 0% |
| Asia | 1,992 | 0% | -3% | 2,587 | 2025-09 | 1,858 | 2025-19 | 8,030 | -1% |
| South America | 2,132 | -6% | 11% | 2,855 | 2025-09 | 1,801 | 2025-01 | 9,010 | 6% |
Source: WingX for Private Jet Card Comparisons. Includes Jets and VIP Airliners.
Fractional and charter operators (37,392 segments) were up 4% year-over-year.
U.S. fractional and charter flying was 6% ahead of last year for the week ending July 6, 2025.
European charter and fractional operators flew 10,987 segments, up 1% year-over-year.
| Market (Part 91K & Part 135) | Week 27 | %Change vs. prior wk | %Change vs. W27 2024 | 52-week high | Week | 52-week low | Week | Last 4 Weeks (Flights) | %Change vs YOY |
| Global | 37,392 | -11% | 4% | 42,159 | 2025-25 | 31,062 | 2025-02 | 162,182 | 4% |
| North America | 24,292 | -16% | 6% | 30,966 | 2024-42 | 23,662 | 2024-35 | 111,072 | 7% |
| USA | 23,589 | -16% | 6% | 30,299 | 2024-42 | 23,012 | 2024-35 | 107,924 | 7% |
| Florida | 2,532 | -13% | 7% | 5,497 | 2025-01 | 2,180 | 2024-35 | 11,511 | 11% |
| California | 2,587 | -11% | 6% | 3,483 | 2024-43 | 2,559 | 2024-36 | 11,491 | 8% |
| Texas | 1,848 | -24% | 12% | 2,845 | 2024-42 | 1,764 | 2024-28 | 8,799 | 16% |
| Europe | 10,987 | 0% | 1% | 11,057 | 2024-29 | 4,649 | 2025-02 | 42,431 | -1% |
| UK | 1,509 | 7% | 0% | 1,616 | 2024-28 | 717 | 2025-03 | 5,662 | -2% |
| Germany | 913 | -5% | -14% | 1,187 | 2024-28 | 417 | 2025-01 | 3,523 | -25% |
| France | 1,685 | -4% | -4% | 1,983 | 2025-25 | 746 | 2025-03 | 7,148 | -1% |
| Switzerland | 657 | -2% | 9% | 799 | 2025-08 | 379 | 2024-47 | 2,531 | 0% |
| Italy | 1,874 | 1% | 13% | 1,874 | 2025-27 | 376 | 2025-01 | 6,949 | 16% |
| Middle East | 797 | 0% | -12% | 1,047 | 2024-31 | 519 | 2025-10 | 3,391 | -4% |
| Africa | 238 | -4% | 4% | 312 | 2024-52 | 185 | 2024-34 | 1,000 | 7% |
| Asia | 265 | 7% | -15% | 412 | 2024-46 | 218 | 2025-19 | 1,014 | -14% |
| South America | 42 | -5% | 35% | 84 | 2025-11 | 27 | 2024-40 | 176 | 25% |
Source: WingX for Private Jet Card Comparisons. Includes Jets and VIP Airliners.
Among the smaller regions, South America posted a 35% year-over-year increase for charter and fractional flights.
However, that brought the weekly total to just 42 segments.


Find the perfect solution for your private aviation needs
Save Time. Buy Confidently.
Receive an apples-to-apples comparison of programs that meet your needs from more than 500 jet card and fractional options covering 65 points of differentiation and over 40,000 data points.