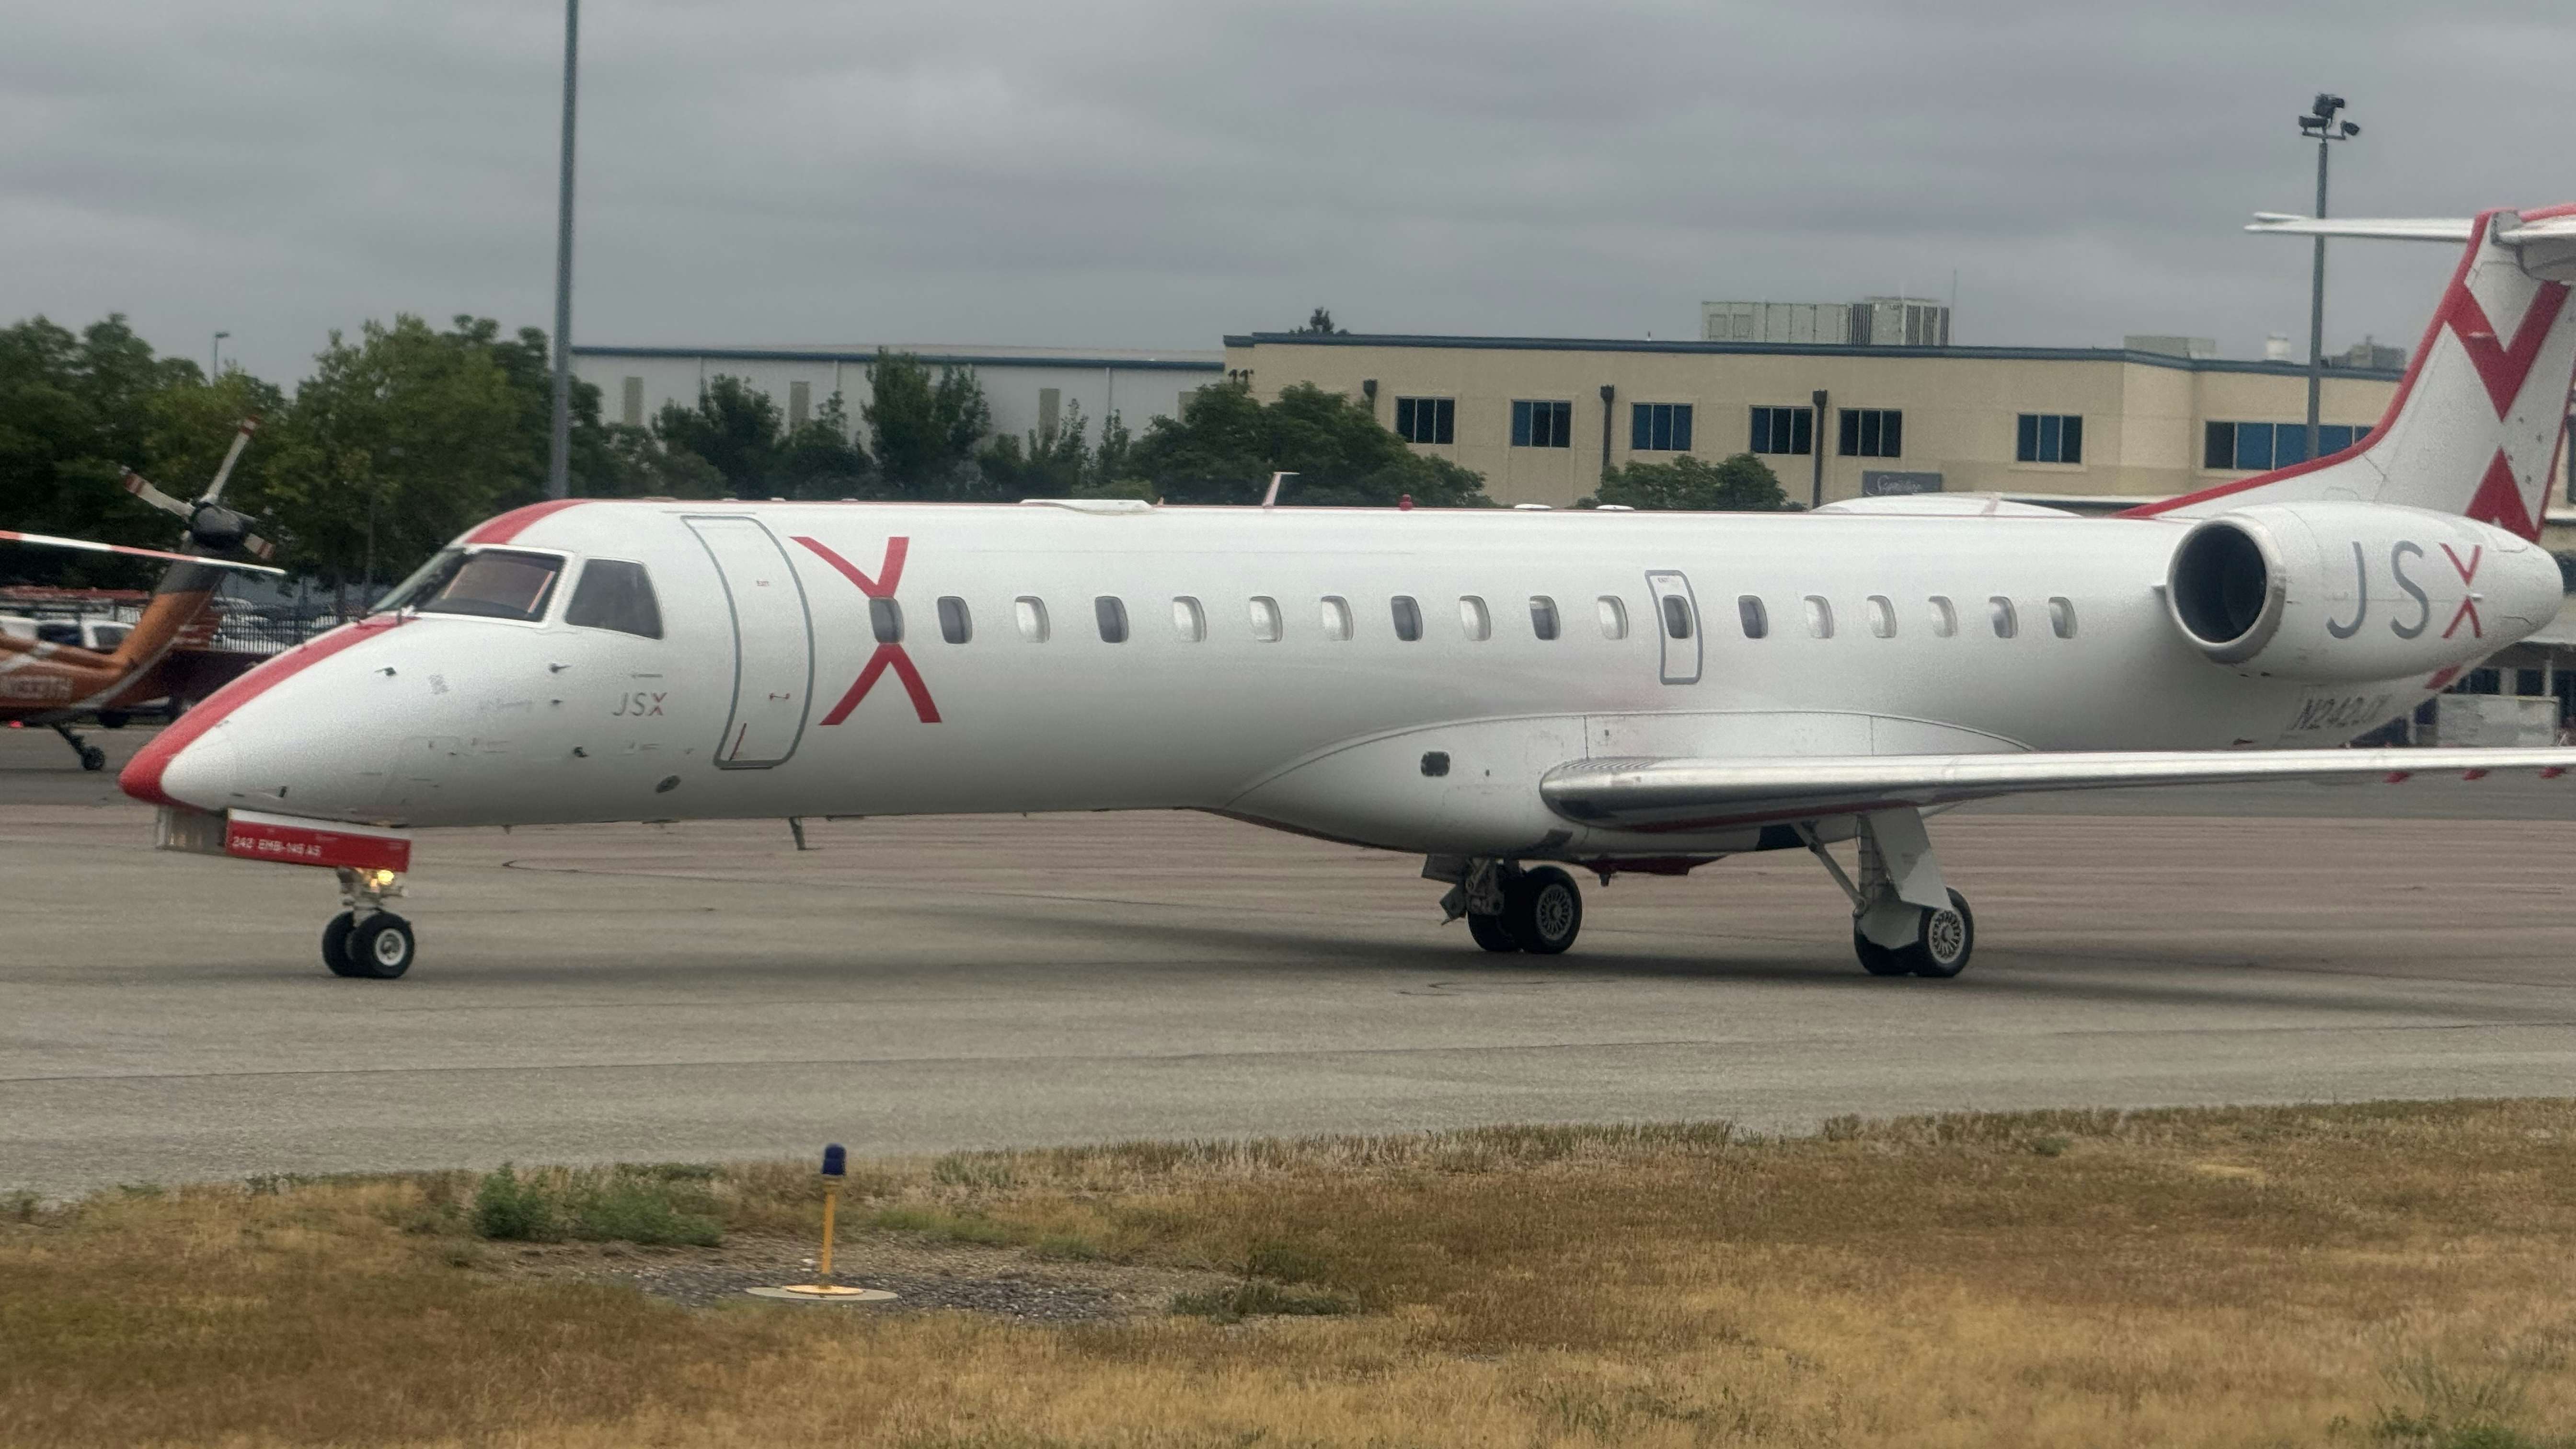
Florida holds its top spot as busiest state with 389,482 private jet flights, as Texas, California, Colorado, and Georgia hold their top five spots.

Florida was the busiest U.S. state for private aviation flights, with 389,482 departures in 2022. That’s a 2.8% increase over 2021.
Behind it, Texas, California, Colorado, and Georgia held their places in the 2nd, 3rd, 4th, and 5th place spots.
There were only three states that moved more than two spots from last year:
Growth was, of course, more tempered.
Last year every state saw a gain, with growth ranging from 21%-to-96%.
This year, six states and one region (the District of Columbia, which includes DCA and IAD numbers) declined compared to 2021.
Only eight states saw double-digit growth.
| 2022 Rank – State – 2021 Rank | 2021 | 2022 | %Share | %Change |
| 1. Florida (1) | 378,767 | 389,482 | 12.0% | 2.8% |
| 2. Texas (2) | 305,086 | 320,888 | 9.9% | 5.2% |
| 3. California (3) | 293,862 | 296,990 | 9.2% | 1.1% |
| 4. Colorado (4) | 118,489 | 118,565 | 3.7% | 0.1% |
| 5. Georgia (5) | 107,457 | 116,049 | 3.6% | 8.0% |
| 6. New Jersey (7) | 93,260 | 105,659 | 3.3% | 13.3% |
| 7. North Carolina (8) | 90,804 | 98,516 | 3.0% | 8.5% |
| 8. New York (6) | 100,113 | 94,418 | 2.9% | -5.7% |
| 9. Tennessee (10) | 77,375 | 87,221 | 2.7% | 12.7% |
| 10. Arizona (9) | 84,024 | 84,342 | 2.6% | 0.4% |
| 11. Illinois (11) | 77,307 | 80,423 | 2.5% | 4.0% |
| 12. Ohio (12) | 73,132 | 75,951 | 2.3% | 3.9% |
| 13. Pennsylvania (14) | 61,391 | 66,250 | 2.0% | 7.9% |
| 14. Michigan (13) | 61,528 | 64,873 | 2.0% | 5.4% |
| 15. South Carolina (15) | 60,537 | 64,041 | 2.0% | 5.8% |
| 16. Massachusetts (16) | 58,721 | 63,286 | 2.0% | 7.8% |
| 17. Nevada (17) | 56,363 | 60,262 | 1.9% | 6.9% |
| 18. Missouri (18) | 55,469 | 59,696 | 1.8% | 7.6% |
| 19. Alabama (19) | 46,043 | 51,044 | 1.6% | 10.9% |
| 20. Indiana (20) | 45,078 | 49,411 | 1.5% | 9.6% |
| 21. Wisconsin (21) | 44,513 | 46,022 | 1.4% | 3.4% |
| 22. Minnesota (22) | 43,171 | 45,064 | 1.4% | 4.4% |
| 23. Virginia (23) | 42,237 | 45,062 | 1.4% | 6.7% |
| 24. Washington (24) | 40,823 | 43,919 | 1.4% | 7.6% |
| 25. Louisiana (27) | 38,053 | 43,119 | 1.3% | 13.3% |
| 26. Kansas (25) | 40,699 | 42,033 | 1.3% | 3.3% |
| 27. Utah (26) | 39,943 | 41,980 | 1.3% | 5.1% |
| 28. Alaska (33) | 31,508 | 40,707 | 1.3% | 29.2% |
| 29. Arkansas (28) | 36,481 | 38,565 | 1.2% | 5.7% |
| 30. Oklahoma (29) | 35,348 | 37,523 | 1.2% | 6.2% |
| 31. New Mexico (30) | 35,210 | 34,748 | 1.1% | -1.3% |
| 32. Montana (31) | 34,905 | 34,496 | 1.1% | -1.2% |
| 33. Oregon (32) | 35,348 | 33,500 | 1.0% | -5.2% |
| 34. Idaho (34) | 31,190 | 33,136 | 1.0% | 6.2% |
| 35. Nebraska (35) | 30,773 | 32,594 | 1.0% | 5.9% |
| 36. Maryland (37) | 26,687 | 31,644 | 1.0% | 18.6% |
| 37. Kentucky (38) | 26,004 | 28,387 | 0.9% | 9.2% |
| 38. South Dakota (36) | 27,170 | 27,427 | 0.8% | 0.9% |
| 39. Mississippi (42) | 23,970 | 27,202 | 0.8% | 13.5% |
| 40. Iowa (40) | 24,760 | 25,978 | 0.8% | 4.9% |
| 41. Hawaii (41) | 24,585 | 24,747 | 0.8% | 0.7% |
| 42. Wyoming (39) | 25,453 | 24,102 | 0.7% | -5.3% |
| 43. DC – IAD/DCA (43) | 23,162 | 23,064 | 0.7% | -0.4% |
| 44. North Dakota (44) | 15,761 | 17,028 | 0.5% | 8.0% |
| 45. Connecticut (45) | 15,000 | 15,859 | 0.5% | 5.7% |
| 46. Maine (46) | 13,798 | 15,008 | 0.5% | 8.8% |
| 47. New Hampshire (47) | 11,859 | 12,710 | 0.4% | 7.2% |
| 48. West Virginia (48) | 11,233 | 11,455 | 0.4% | 2.0% |
| 49. Rhode Island (49) | 6,147 | 6,275 | 0.2% | 2.1% |
| 50. Delaware (50) | 5,410 | 5,288 | 0.2% | -2.3% |
| 51. Vermont (51) | 5,096 | 4,736 | 0.1% | 22.0% |
Alaska had the biggest growth in 2022, up 29.2%.
Vermont (+22.0%), Maryland (+18.6%), Mississippi (+13.5%), Louisiana (+13.3%), New Jersey (+13.3%), Tennessee (+12.7%), and Alabama (+10.9%) each saw double-digit growth in private aviation flights.
The big three states – Florida, Texas, and California – continue to play an outsized role for private jet flyers. The trio account for 31.1% of all U.S. activity.
Texas saw 5.2% growth. California private aviation departures were up 1.1%.
Editor’s Note: An earlier version has been updated with corrections.