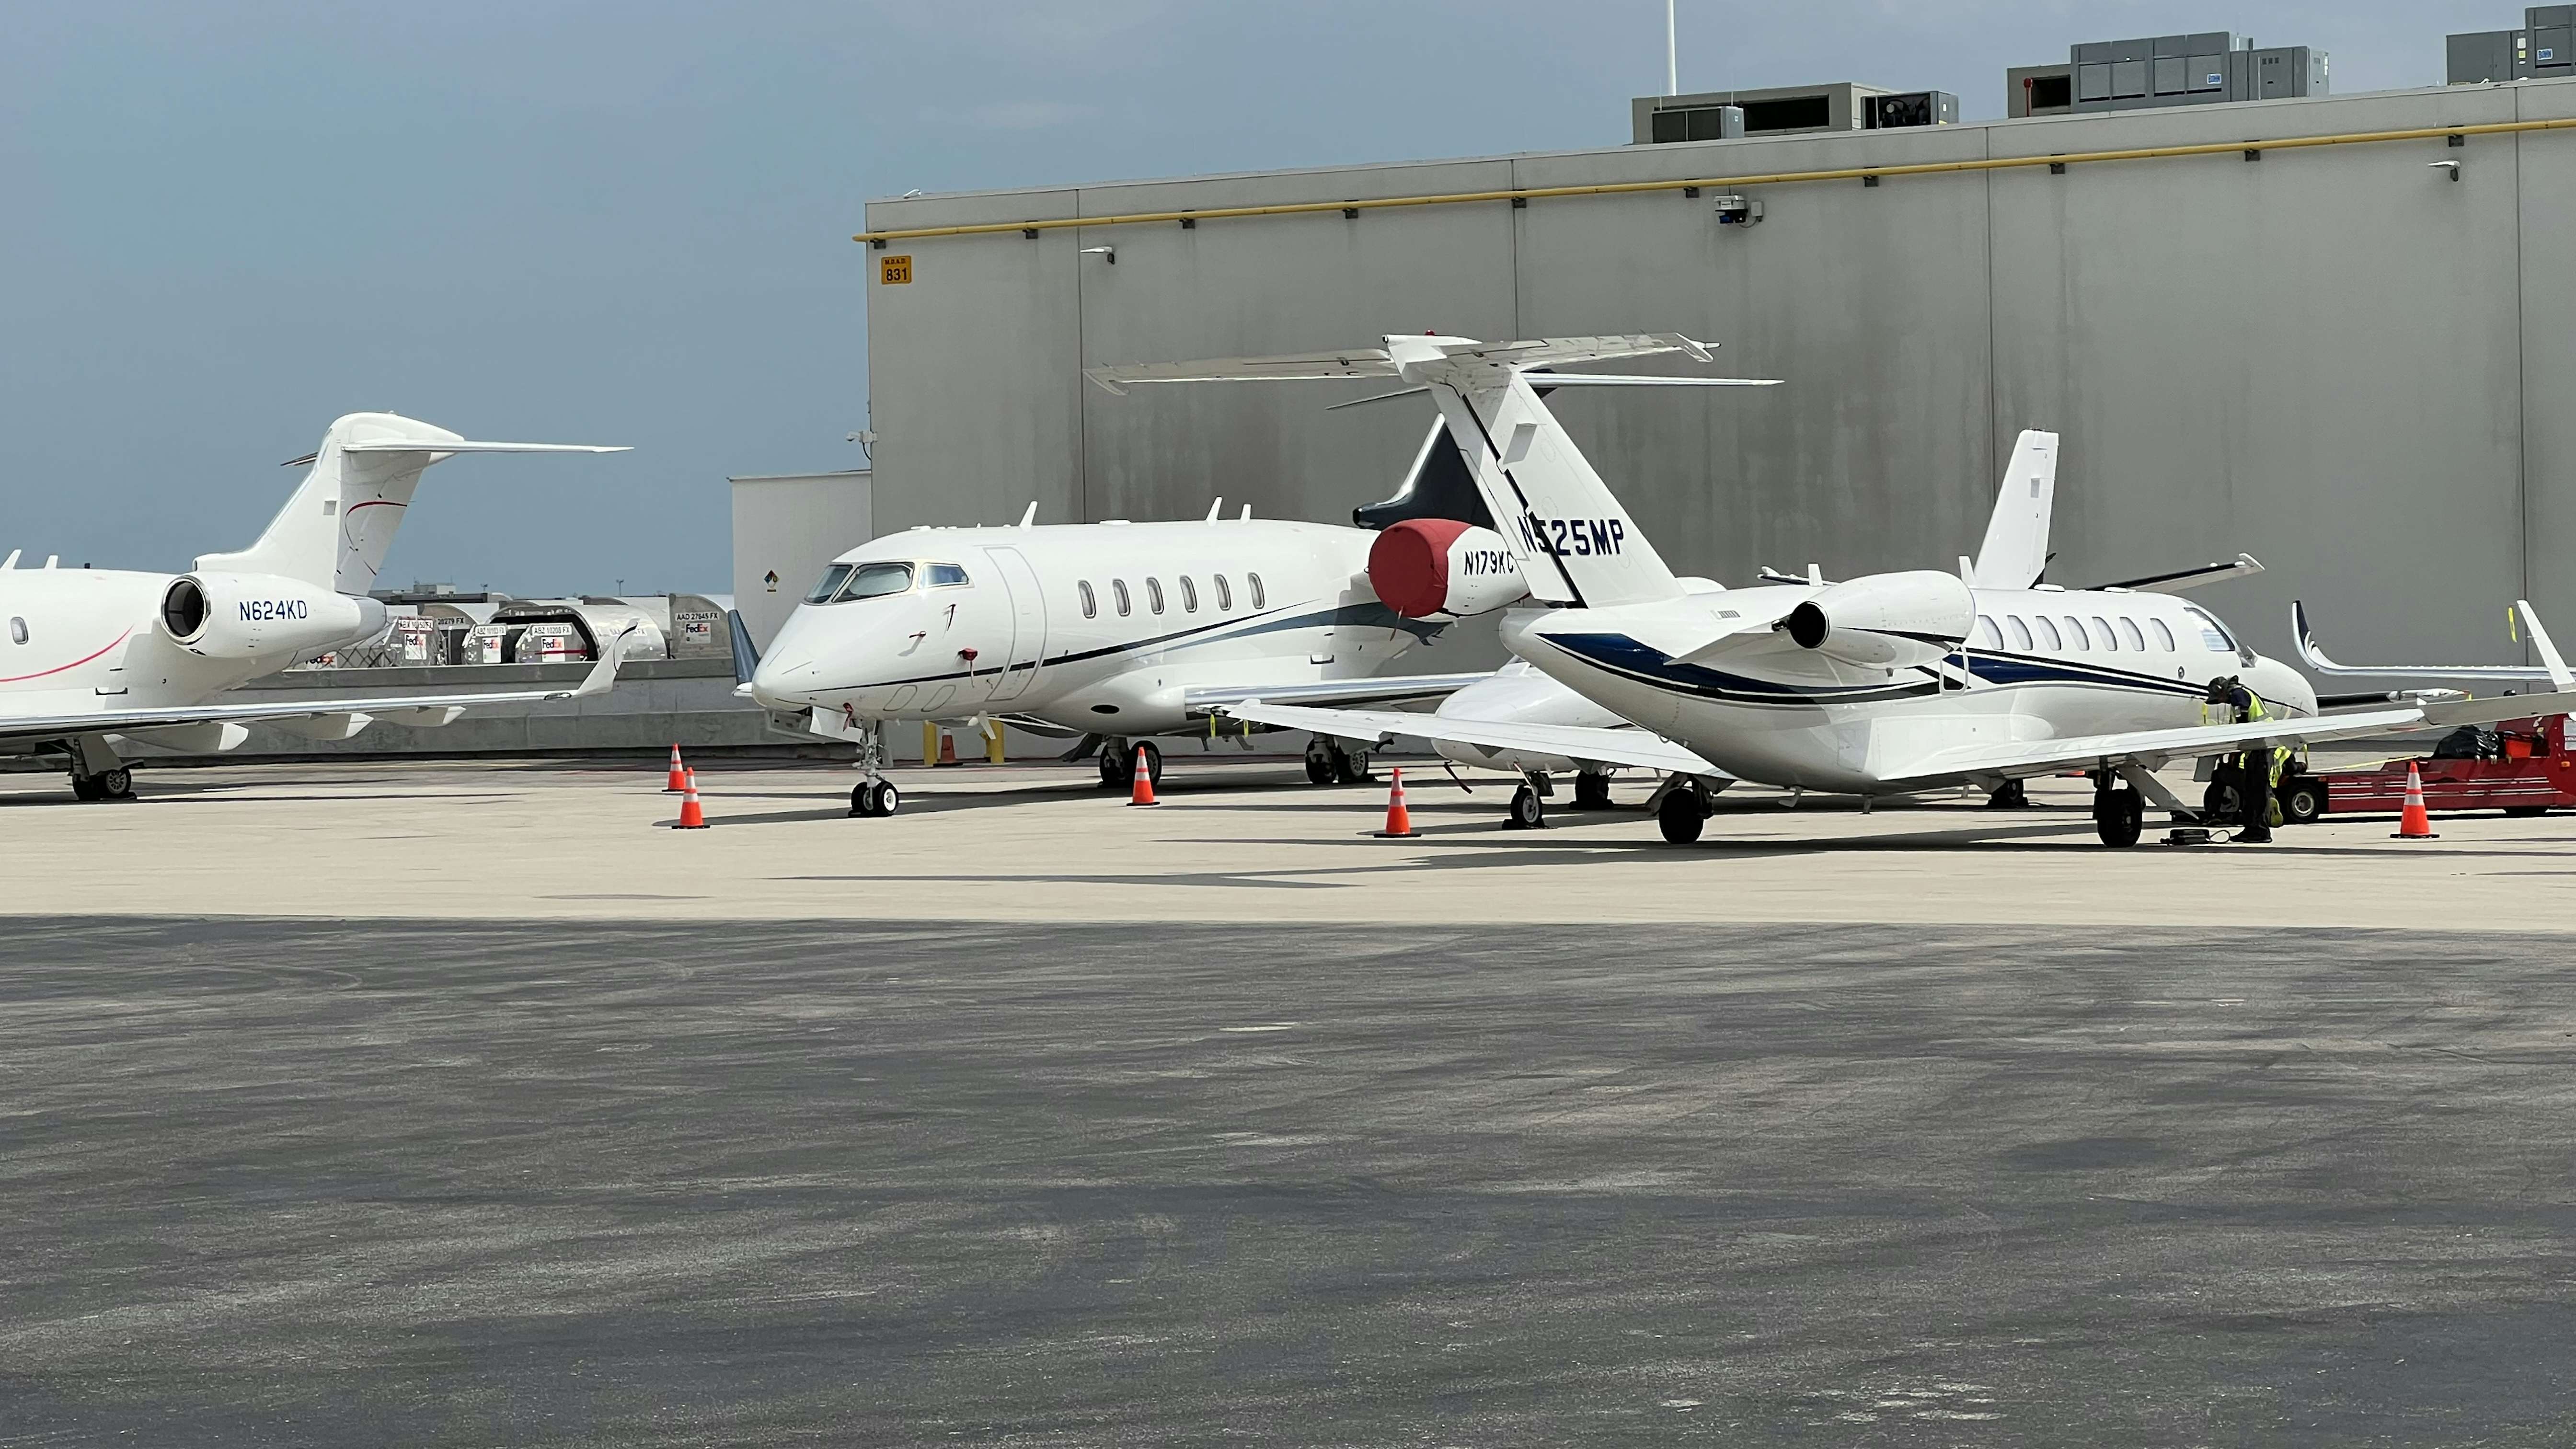
Global private jet flight activity increased 3% week-to-week, with 69,673 flights. That was 7% down from 2022’s record clip.

Global private jet flight activity increased 3% week-to-week, with 69,673 flights, still 7% below 2022.
The U.S. accounted for 46,754 flights, driving Week 23, flying 5% ahead of the previous week.
Those numbers were 8% below last year for the week ending June 11.
Europe saw a 4% week-to-week gain with 14,043 flights, also 8% below the same period in 2022.
| Market | Week 23 | %Change vs. prior week | %Change vs. 2022 (dates) | 52-week high | Week | 52-week low | Week | Last 4 Weeks | % Change vs. 2022 |
| Global | 69,673 | 3% | -7% | 78,503 | W25 2022 | 57,233 | W51 2022 | 278,749 | -6% |
| North America | 50,784 | 4% | -8% | 58838 | W41 2022 | 43,691 | W51 2022 | 206,079 | -6% |
| USA | 46,754 | 5% | -8% | 55070 | W41 2022 | 38,832 | W51 2022 | 188,778 | -7% |
| Florida | 5,204 | -3% | -9% | 9,174 | W8 2023 | 3,744 | W39 2022 | 22,762 | -8% |
| California | 4,336 | -2% | -17% | 5512 | W46 2022 | 4,066 | W51 2022 | 18,067 | -12% |
| Texas | 4,466 | 6% | -11% | 5,797 | W43 2022 | 3,730 | W5 2023 | 18,554 | -9% |
| Europe | 14,043 | 4% | -8% | 17,608 | W26 2022 | 6,648 | W52 2022 | 52,374 | -11% |
| UK | 1,802 | 4% | -15% | 2,336 | W26 2022 | 982 | W52 2022 | 6,883 | -12% |
| Germany | 1,480 | 9% | -4% | 1,915 | W26 2022 | 651 | W52 2022 | 5,697 | -14% |
| France | 2,383 | 2% | -6% | 2,905 | W29 2022 | 1,011 | W52 2022 | 8,849 | -14% |
| Switzerland | 767 | 6% | -3% | 1,039 | W3 2023 | 549 | W47 2022 | 3,067 | -18% |
| Italy | 1,736 | 1% | -14% | 2,357 | W28 2022 | 511 | W52 2022 | 6,366 | -5% |
| Middle East | 1,624 | 14% | 13% | 2,173 | W50 2022 | 984 | W52 2022 | 5,644 | 1% |
| Africa | 827 | -13% | 2% | 987 | W17 2023 | 622 | W2 2023 | 3,525 | 11% |
| Asia | 2,195 | 0% | 2% | 3,269 | W50 2022 | 1,786 | W32 2022 | 8,938 | 10% |
| South America | 1,348 | 5% | 19% | 1,490 | W6 2023 | 1006 | W29 2022 | 5,572 | 20% |
Fractional and charter operators saw a 2% week-to-week gain with 35,537 flights, 10% down from last year.
The U.S. made up 23,586 of the fractional and charter flights, 2% up from Week 22 but 9% below 2022.
| Market (Part 91K & Part135) | Week 23 | %Change vs. prior wk | %Change vs. 2022 | 52-week high | Week | 52-week low | Week | Last 4 Weeks | %Change vs. 2022 |
| Global | 35,537 | 2% | -10% | 41,552 | W25 2022 | 31,174 | W51 2022 | 141,707 | -8% |
| North America | 24,776 | 2% | -8% | 30,412 | W52 2022 | 22,967 | W35 2022 | 101,645 | -8% |
| USA | 23,586 | 2% | -9% | 29,057 | W41 2022 | 21,948 | W35 2022 | 96,791 | -8% |
| Florida | 2,859 | -4% | -10% | 5,792 | W52 2022 | 2,024 | W39 2022 | 12,678 | -9% |
| California | 2,504 | -6% | -18% | 3,410 | W46 2022 | 2,635 | W51 2022 | 10,691 | -14% |
| Texas | 1,918 | 4% | -10% | 2,494 | W42 2022 | 1,644 | W27 2022 | 7,864 | -8% |
| Europe | 10,029 | 4% | -13% | 12,962 | W27 2022 | 4,995 | W52 2022 | 37,075 | -17% |
| UK | 1,348 | 7% | -19% | 1,772 | W26 2022 | 735 | W2 2023 | 5,014 | -18% |
| Germany | 1,100 | 16% | 0% | 1,295 | W25 2022 | 516 | W52 2022 | 4,003 | -16% |
| France | 1,687 | -3% | -13% | 2,178 | W29 2022 | 764 | W52 2022 | 6,373 | -20% |
| Switzerland | 550 | 5% | -6% | 776 | W7 2023 | 415 | W47 2022 | 2,175 | -21% |
| Italy | 1,312 | 3% | -17% | 1,855 | W28 2022 | 389 | W52 2022 | 4,794 | -10% |
| Middle East | 776 | 13% | 4% | 1,075 | W50 2022 | 512 | W52 2022 | 2,683 | -9% |
| Africa | 220 | -11% | -12% | 341 | W17 2023 | 160 | W35 2022 | 878 | -11% |
| Asia | 459 | -4% | -17% | 1,015 | W50 2022 | 407 | W30 2022 | 1,925 | -8% |
| South America | 27 | 50% | 13% | 83 | W45 2022 | 13 | W24 2022 | 97 | 9% |
There were 10,029 charter and fractional flights in Europe, a 4% increase week-to-week and 13% under 2021.