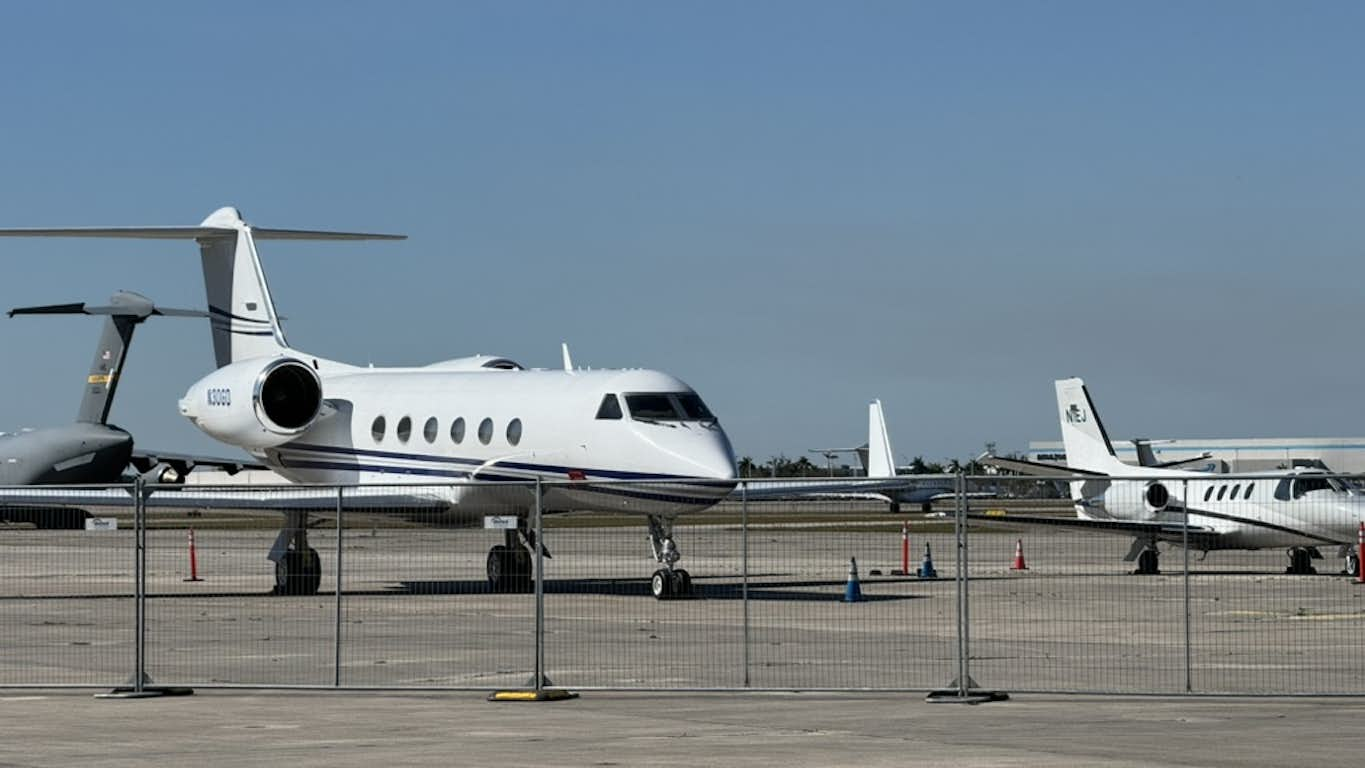
While fractional private jet operators continued their strong performance, Argus TraqPak data shows changes in day-of-week travel patterns.

According to Argus TraqPak, North American fractional operators saw a 12.4% year-over-year gain in flight activity during the first six months of 2024.
The results countered declines in Part 135 market (charter operators) and Part 91, non-commercial flights.
Part 91 saw the steepest drop, down 5.5%, while the charter and jet card flights dropped 5.2%.
Altogether, private aviation flights in North America were down 2.7% in H1 2024.
READ: The biggest Charter/Fractional private jet operators so far in 2024
“Six months are complete in 2024, and a similar picture remains in the North American Business Aviation market. We continue to see consistent declines in the Part 135 market, a declining Part 91 market, and a very strong Fractional market,” says Argus SVP, Software Travis Kuhn, adding, “The overall market in North America remains strong.”
Part 91 flying dropped from 810,687 departures in H1 2023 to 764,953 during the first six months of this year.
Part 135 flying declined from 644,906 segments to 610,530.
Fractional departures increased from 274,504 in last year’s first six months to 308,043 in 2024.

The TraqPak data also provides a look back at the peak of 2022.
Fractional operators operated 20.3% more flights.
Part 91 flying showed a two-year decline of 7.3%, with charter operators taking a 14.7% hit.
READ: Private Jet Flight Activity 2007 to 2023
Regarding aircraft categories, Midsize jet activity was up 1% year-over-year during the first half of 2024.
All other categories were in the red.
Large cabin segments dropped the most, down 5.9%.
Light jets (-3.6%) and Turboprops (-3.5%) had similar declines.
During the first half of 2024, the U.S. accounted for 66.9% of private aviation flying.
Canada was second with 4.5% of global activity.
Thursdays (10,674 average flights) and Fridays (10,029 flights) were the busiest days of the week.
Saturday remained the slowest day of the week, with an average of 7,004 flights, followed by Sunday, which averaged 8,449 flights.
There are signs that the work-anywhere trend could be winding down as executives return to more normal office hours and travel patterns.
Monday recorded the most significant drop, down 5.4% year over year.
The smallest yearly decrease occurred on Sunday, down 2% from 2023.
H1 2024 saw 57 days with 10,000 or more flights, compared to 76 dates in H1 2023.
So far this year, the lowest date for departures was the Sunday before Memorial Day.
Its 4,725 flights were well below the second slowest date, Jan. 20, which had 6,085 flights.
The Argus analysts estimate that flight activity from July through December will decrease by 1.1% over the same period in 2023.
That would be a 3% increase compared to H1 2024.
That would put overall 2024 private aviation flying activity down 1.9% from 2023.
If the forecast holds, private jet flying will still be 9.6% ahead of 2019, even though it is down 5.1% from 2022.