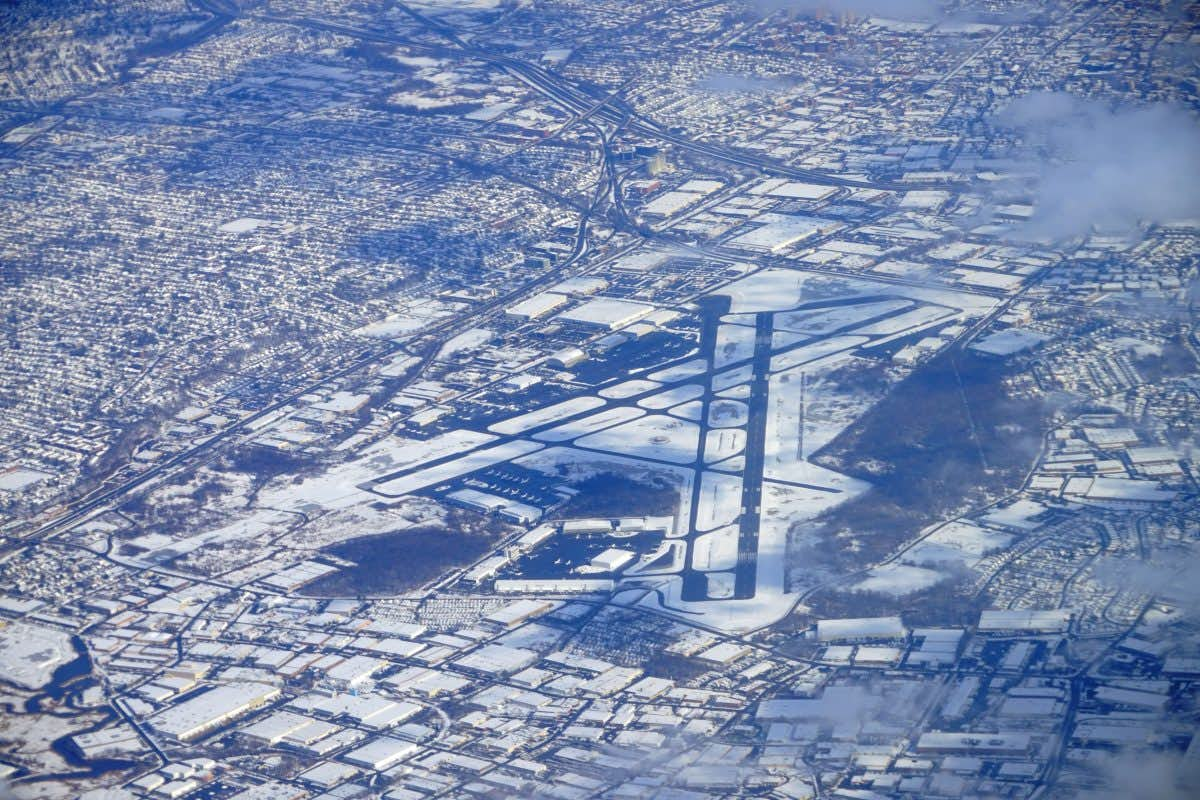
Teterboro held its position as top airport for private jets with a 70% spike in private jet departures in 2021.

The 25 busiest U.S. private jet airports got even busier in 2021 as private flights hit record levels. All airports on the list showed a double-digit increase, with first-place Teterboro Airport flights increasing 70% to 62,537, 171 per day. See the 2020 list here.
Palm Beach International moved up from third to second with a 58% increase (see table below), while Dallas Love Field dropped to third despite a 34% jump in private jet flights.
Van Nuys Airport, serving Los Angeles, kept its fourth spot. Westchester County Airport, north of New York City, moved into fifth place, trading places with Denver Centennial Airport. HPN saw a 64% increase in flights, while APA had a 32% gain.
A 78% jump in private jets helped Las Vegas Harry Reid International Airport move from 13th to 7th. Miami’s Opa Locka Executive Airport used a 68% increase in private jet flights to jump six spots to 8th, according to Argus TraqPak.
| Rank 2021 (20) |
Airport – City – State | 2020 Departures |
2021 Departures |
% YOY Change |
| 1. (1) | KTEB – Teterboro – NJ | 36,855 | 62,537 | 70% |
| 2. (3) | KPBI – Palm Beach, FL | 27,988 | 44,254 | 58% |
| 3. (2) | KDAL – Dallas, TX | 30,000 | 40,093 | 34% |
| 4. (4) | KVNY – Los Angeles, CA | 24,870 | 36,238 | 46% |
| 5. (6) | KHPN – White Plains, NY | 21,958 | 36,039 | 64% |
| 6. (5) | KAPA – Denver, CO | 24,282 | 31,949 | 32% |
| 7. (13) | KLAS – Las Vegas, NV | 17,501 | 31,221 | 78% |
| 8. (14) | KOPF – Miami, FL | 18,083 | 30,419 | 68% |
| 9. (8) | KPDK – Atlanta, GA | 20,595 | 29,272 | 42% |
| 10. (7) | KSDL – Scottsdale, AZ | 21,949 | 28,936 | 32% |
| 11. (9) | KHOU – Houston, TX | 20,297 | 28,155 | 39% |
| 12. (10) | KAPF – Naples, FL | 18,961 | 26,734 | 41% |
| 13. (11) | KIAD – Washington D.C. | 18,283 | 26,048 | 43% |
| 14. (12) | KSNA – Orange County, CA | 17,944 | 25,678 | 43% |
| 15. (23) | KAUS – Austin, TX | 12,769 | 22,182 | 74% |
| 16. (15) | KSLC – Salt Lake City, UT | 15,777 | 21,489 | 36% |
| 17. (19) | KMDW – Chicago, IL | 13,223 | 20,813 | 57% |
| 18. (16) | KFXE – Ft. Lauderdale, TX | 13,965 | 20,730 | 48% |
| 19. (18) | KBNA – Nashville, TN | 13,318 | 20,621 | 55% |
| 20. (21) | KBED – Boston, MA | 13,130 | 19,407 | 48% |
| 21. (17) | KPWK – Chicago, IL | 13,445 | 19,394 | 44% |
| 22. (24) | KFLL – Ft. Lauderdale, FL | 12,897 | 18,992 | 47% |
| 23. (25) | KSAT – San Antonio, TX | 12,527 | 18,270 | 46% |
| 24. (20) | KBFI – Seattle, WA | 13,259 | 18,194 | 37% |
| 25. (NR) | KSJC – San Jose, CA | 11,278 | 16,282 | 44% |
While Atlanta Peachtree DeKalb saw a 42% increase in flights it still dropped one notch to 9th. Scottsdale Municipal Airport had a 32% gain. It dropped three spots, just staying in the top 10.
Houston Hobby Airport led the second 10, dropping two spots even though flights were up 39%.
However, the biggest mover in the top 25 was Austin Bergstrom which used a 74% increase in private jet departures to jump eight spots from 23rd to 15th.