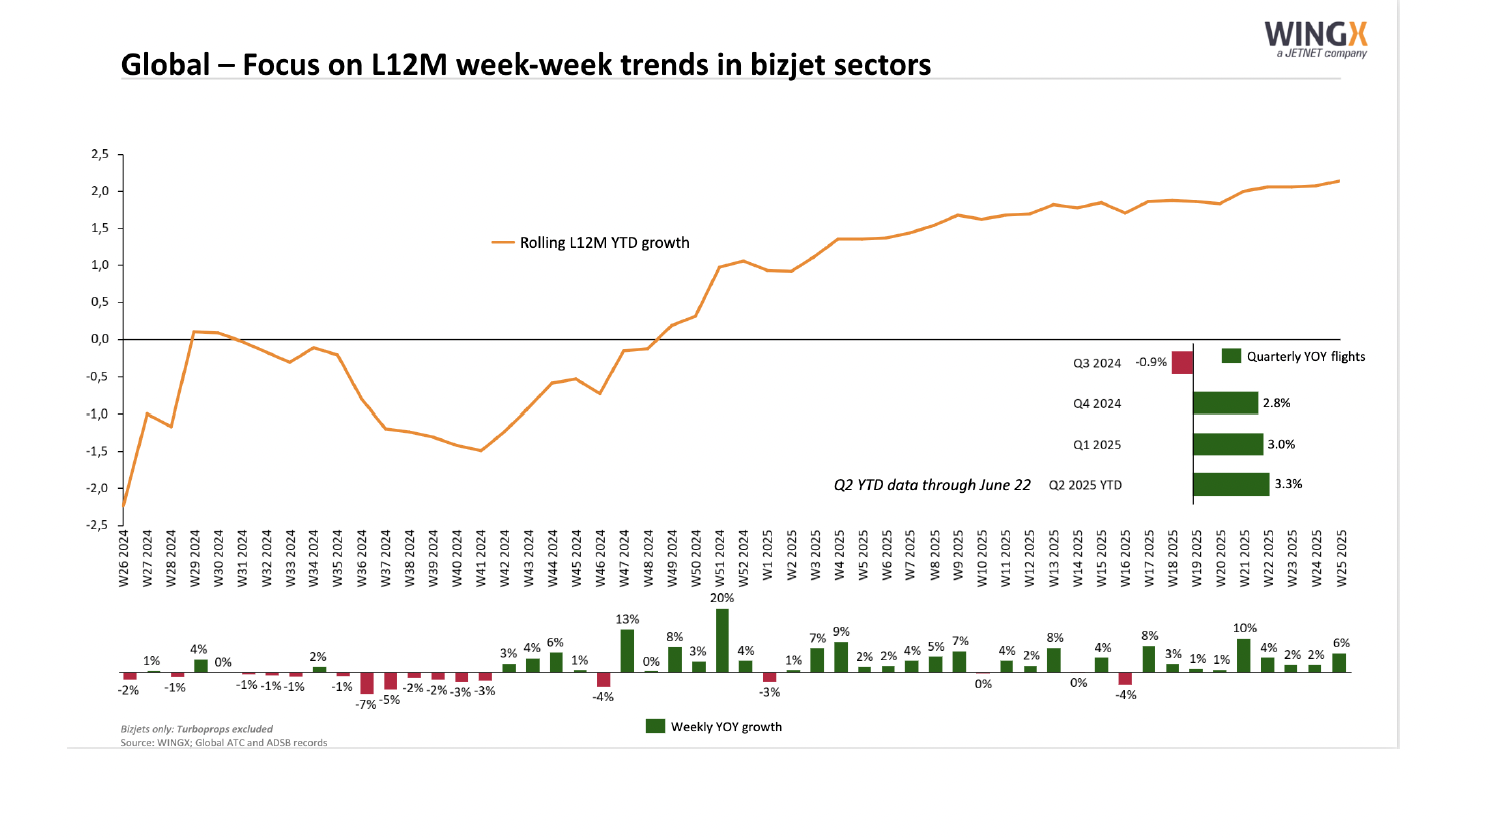

Private jet flight activity rebounded from last week after Hurricane Ian, according to the latest data from WingX.
Global private jet departures increased 2% to 71,968 from last week, still 4% below 2021’s numbers.
Over the past month, there were 293,403 flights, up 0.3% compared to 2021.
In the U.S., Florida private jet flights were up 52% week-to-week and tracked 1% ahead of 2021.
In Europe, private flying was down 14% from Week 39 and 17% below last year’s levels.
| Market | Week 40 | %Change vs. prior week | %Change vs 2021 | 52- week high | Week | 52- week low | Week | Last 4 Weeks | %Change vs. 2021 |
| Global | 71,968 | 2% | -4% | 78,406 | W25 2022 | 59,546 | W02 2022 | 293,403 | 0.3% |
| North America | 55,728 | 7% | -2% | 62,572 | W14 2022 | 46,656 | W27 2022 | 222,031 | 2% |
| USA | 51,702 | 7% | -1% | 57,147 | W14 2022 | 42,240 | W27 2022 | 206,036 | 2% |
| Florida | 5,694 | 52% | 1% | 10,600 | W8 2022 | 3,744 | W39 2022 | 19,078 | -3% |
| California | 4,891 | 1% | -7% | 6,391 | W7 2022 | 4,211 | W27 2022 | 19,565 | -3% |
| Texas | 5,270 | -1% | 0% | 6,176 | W10 2022 | 3,850 | W27 2022 | 21,466 | 9% |
| Europe | 11,546 | -14% | -17% | 17,559 | W26 2022 | 7,583 | W52 2021 | 53,090 | -11% |
| UK | 1,599 | -15% | -11% | 2,334 | W26 2022 | 894 | W52 2021 | 7,240 | -1% |
| Germany | 1472 | -14% | -11% | 1,913 | W26 2022 | 704 | W52 2021 | 6,784 | -6% |
| France | 1,777 | -20% | -19% | 3,028 | W21 2022 | 1,045 | W52 2021 | 7,996 | -16% |
| Switzerland | 723 | -3% | -21% | 1,209 | W21 2022 | 637 | W48 2021 | 3,155 | -16% |
| Italy | 1,247 | -14% | -4% | 2,352 | W28 2022 | 456 | W1 2022 | 6,055 | -3% |
| Middle East | 1,316 | -11% | -6% | 1,577 | W34 2022 | 918 | W4 2022 | 5,681 | 14% |
| Africa | 734 | 6% | 5% | 857 | W19 2022 | 495 | W52 2021 | 2,784 | 3% |
| Asia | 2,090 | -9% | 16% | 2,286 | W12 2022 | 1,560 | W52 2021 | 8,295 | 26% |
| South America | 1,272 | 11% | 2% | 1,433 | W50 2021 | 844 | W52 2021 | 4,850 | 6% |
Global fractional and charter flights rebounded, up 7% week-to-week but still 11% below 2021 levels for the same period.
Last week’s fractional and charter numbers were under-reported due to an error in data collection processing, according to WingX.
In the U.S., fractional and charter flights climbed 13% to 27,148 departures, which was 9% below 2021.
U.S. charter and fractional flying tracked 10% under 2021 levels for the past month.
| Market (Part 91K & Part135) | Week 40 | %Change vs prior wk | %Change vs 2021 | 52- week high | Week | 52- week low | Week | Last 4 Weeks | %Change vs. 2021 |
| Global | 37,984 | 7% | -11% | 39,663 | W41 2021 | 31,964 | W2 2022 | 148,416 | -11% |
| North America | 28,524 | 13% | -8% | 31,369 | W8 2022 | 23,038 | W35 2022 | 107,792 | -9% |
| USA | 27,148 | 13% | -9% | 29,890 | W8 2022 | 21,964 | W35 2022 | 102,809 | -10% |
| Florida | 3,280 | 62% | -2% | 6,065 | W52 2021 | 2,022 | W39 2022 | 10,251 | -11% |
| California | 3,069 | 9% | -12% | 3,970 | W7 2022 | 2,638 | W27 2022 | 11,768 | -12% |
| Texas | 2,404 | 10% | -4% | 2,671 | W10 2022 | 1,647 | W27 2022 | 8,931 | -3% |
| Europe | 8,567 | -10% | -19% | 12,441 | W27 2022 | 5,530 | W52 2021 | 37,474 | -18% |
| UK | 1,196 | -9% | -14% | 1,681 | W26 2022 | 685 | W2 2022 | 5,178 | -9% |
| Germany | 1,056 | -11% | -11% | 1,241 | W26 2022 | 508 | W52 2021 | 4,648 | -11% |
| France | 1,297 | -16% | -22% | 2,233 | W21 2022 | 703 | W2 2022 | 5,676 | -22% |
| Switzerland | 537 | -1% | -25% | 819 | W21 2022 | 427 | W17 2022 | 2,255 | -22% |
| Italy | 970 | -11% | -8% | 1,802 | W28 2022 | 336 | W1 2022 | 4,581 | -11% |
| Middle East | 749 | -2% | -15% | 882 | W34 2022 | 319 | W3 2022 | 2,937 | -9% |
| Africa | 286 | 55% | 9% | 180 | W13 2022 | 92 | W5 2022 | 860 | -12% |
| Asia | 539 | -8% | 5% | 309 | W43 2021 | 156 | W4 2022 | 2,117 | 19% |
| South America | 55 | 72% | 17% | 35 | W50 2021 | 8 | W47 2021 | 142 | 1% |
After Hurricane Ian, Florida charter and fractional flights jumped 62% from the previous week.
Still, they were 11% below 2021’s record-setting pace for the trailing four weeks.