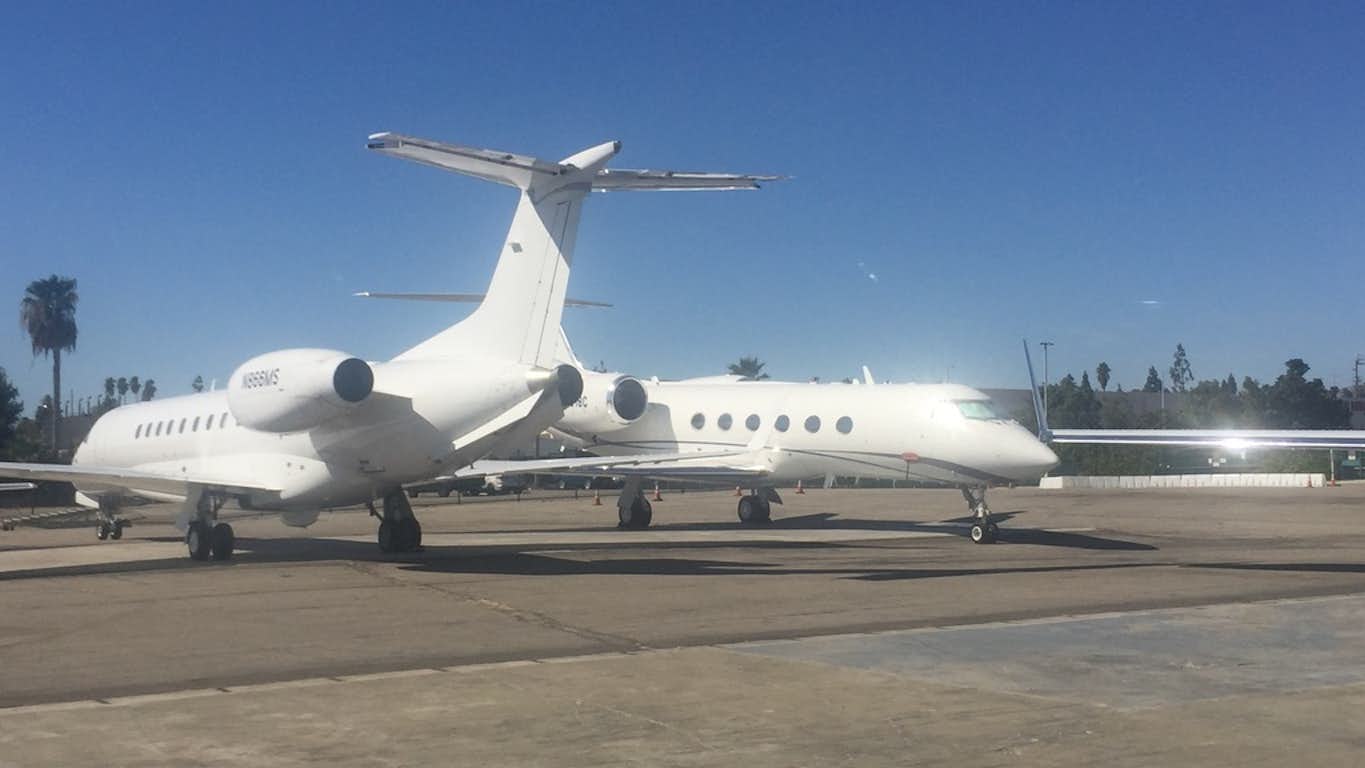
The business jet market will grow steadily over the next five years, with total five-year transaction volume reaching $247 billion, according to an industry forecast.
Global Jet Capital‘s report, the annual 5-Year New & Pre-Owned Transaction Forecast, draws on data from companies and OEMs.
It predicts the business jet market will grow year over year through 2030, despite global uncertainties.
The report predicts that total transaction volume will increase 2.8% annually, while dollar volume will grow 4.1% annually.
“We have experienced a series of disruptive geopolitical events,” said Andrew Farrant, Global Jet Capital Chief Marketing Officer, in the report’s preface.
Farrant continued;
‘A global pandemic, the largest ground war in Europe since World War II, escalating global tariffs, and, most recently, U.S. military action in the Middle East materially impacting global crude oil markets. The business aviation industry has persevered because at its core, it is a strong, mature industry that provides an unequaled value proposition to its users.’
Total market unit and dollar volume, from 2021-2030
| Category |
2021 |
2022 |
2023 |
2024 |
2025 |
2026 |
2027 |
2028 |
2029 |
2030 |
| New |
712 |
694 |
710 |
732 |
826 |
853 |
909 |
928 |
915 |
928 |
| Pre-Owned |
3,242 |
2,850 |
2,355 |
2,383 |
2,771 |
2,872 |
2,943 |
3,029 |
3,120 |
3,194 |
| Total Units |
3,954 |
3,544 |
3,065 |
3,115 |
3,597 |
3,725 |
3,852 |
3,957 |
4,035 |
4,122 |
| New |
$15.6B |
$16.1B |
$16.4B |
$19.0B |
$22.5B |
$24.2B |
$26.1B |
$26.5B |
$26.6B |
$27.3B |
| Pre-Owned |
$16.7B |
$20.3B |
$16.7B |
$17.7B |
$20.7B |
$21.4B |
$22.2B |
$23.2B |
$24.5B |
$25.4B |
| Total Dollars |
$32.3B |
$36.4B |
$33.1B |
$36.7B |
$43.2B |
$45.6B |
$48.3B |
$49.7B |
$51.1B |
$52.8B |
2026 onward is a forecast. Source: Global Jet Capital Annual Business Jet Market Forecast, 2026
The report notes that backlogs at major business jet OEMs are significantly higher than five years ago, and that new deliveries should increase 3.3% in 2026.
It also forecasts annual new-delivery growth of 2.4% over the next five years.
Despite tariff uncertainties in 2025 and oil price volatility in 2026, the report believes steady economic growth and wealth creation, along with sustained demand for business aviation, will continue to support business jet transactions.
Jet production is also expected to grow across all size classes, with the largest increase in heavy jets, at about 3.3% YoY through 2030.
Business Jet Transactions by size, 2021-2030
| Category |
2021 |
2022 |
2023 |
2024 |
2025 |
2026 |
2027 |
2028 |
2029 |
2030 |
| VLJ |
164 |
148 |
154 |
141 |
153 |
162 |
167 |
169 |
156 |
153 |
| Light |
192 |
174 |
182 |
178 |
185 |
186 |
200 |
207 |
206 |
204 |
| Medium |
143 |
165 |
175 |
192 |
219 |
225 |
238 |
240 |
244 |
254 |
| Heavy |
213 |
207 |
199 |
221 |
269 |
280 |
304 |
312 |
309 |
317 |
| Total New Jets |
712 |
694 |
710 |
732 |
826 |
853 |
909 |
928 |
915 |
928 |
| VLJ |
681 |
609 |
546 |
524 |
578 |
626 |
651 |
684 |
723 |
749 |
| Light |
1,020 |
925 |
753 |
761 |
881 |
904 |
909 |
911 |
906 |
913 |
| Medium |
723 |
612 |
480 |
471 |
567 |
577 |
582 |
586 |
584 |
587 |
| Heavy |
818 |
704 |
576 |
627 |
745 |
765 |
801 |
849 |
908 |
944 |
| Total Pre-Owned Jets |
3,242 |
2,850 |
2,355 |
2,383 |
2,771 |
2,872 |
2,943 |
3,029 |
3,120 |
3,194 |
2026 onward is a forecast. Source: Global Jet Capital Annual Business Jet Market Forecast, 2026
Looking worldwide, North America is forecast to account for 73.9% of all business jet transactions over the next five years, followed by Latin America, Europe, Asia Pacific, and the Middle East/Africa.
The report highlighted Asia Pacific and Middle East/Africa as key growth opportunities, especially South/Southeast Asia and the Persian Gulf.
“In these markets,” states the report, “sustained wealth creation over the last 25 years has resulted in a growing user base that appreciates the value proposition of business aircraft. This is translating to strong aircraft acquisition activity on what is a relatively small installed base.”
Forecast of all new and pre-owned aircraft transactions, by global region
| Region |
New Transactions |
Pre-Owned Transactions |
New Ratio |
Pre-Owned Ratio |
| North America |
3,241 |
11,325 |
22% |
78% |
| Europe |
530 |
882 |
38% |
62% |
| Latin America |
417 |
1,979 |
17% |
83% |
| Asia/Pacific |
200 |
462 |
30% |
70% |
| Middle East/Africa |
146 |
509 |
22% |
78% |
Source: Global Jet Capital Annual Business Jet Market Forecast, 2026.