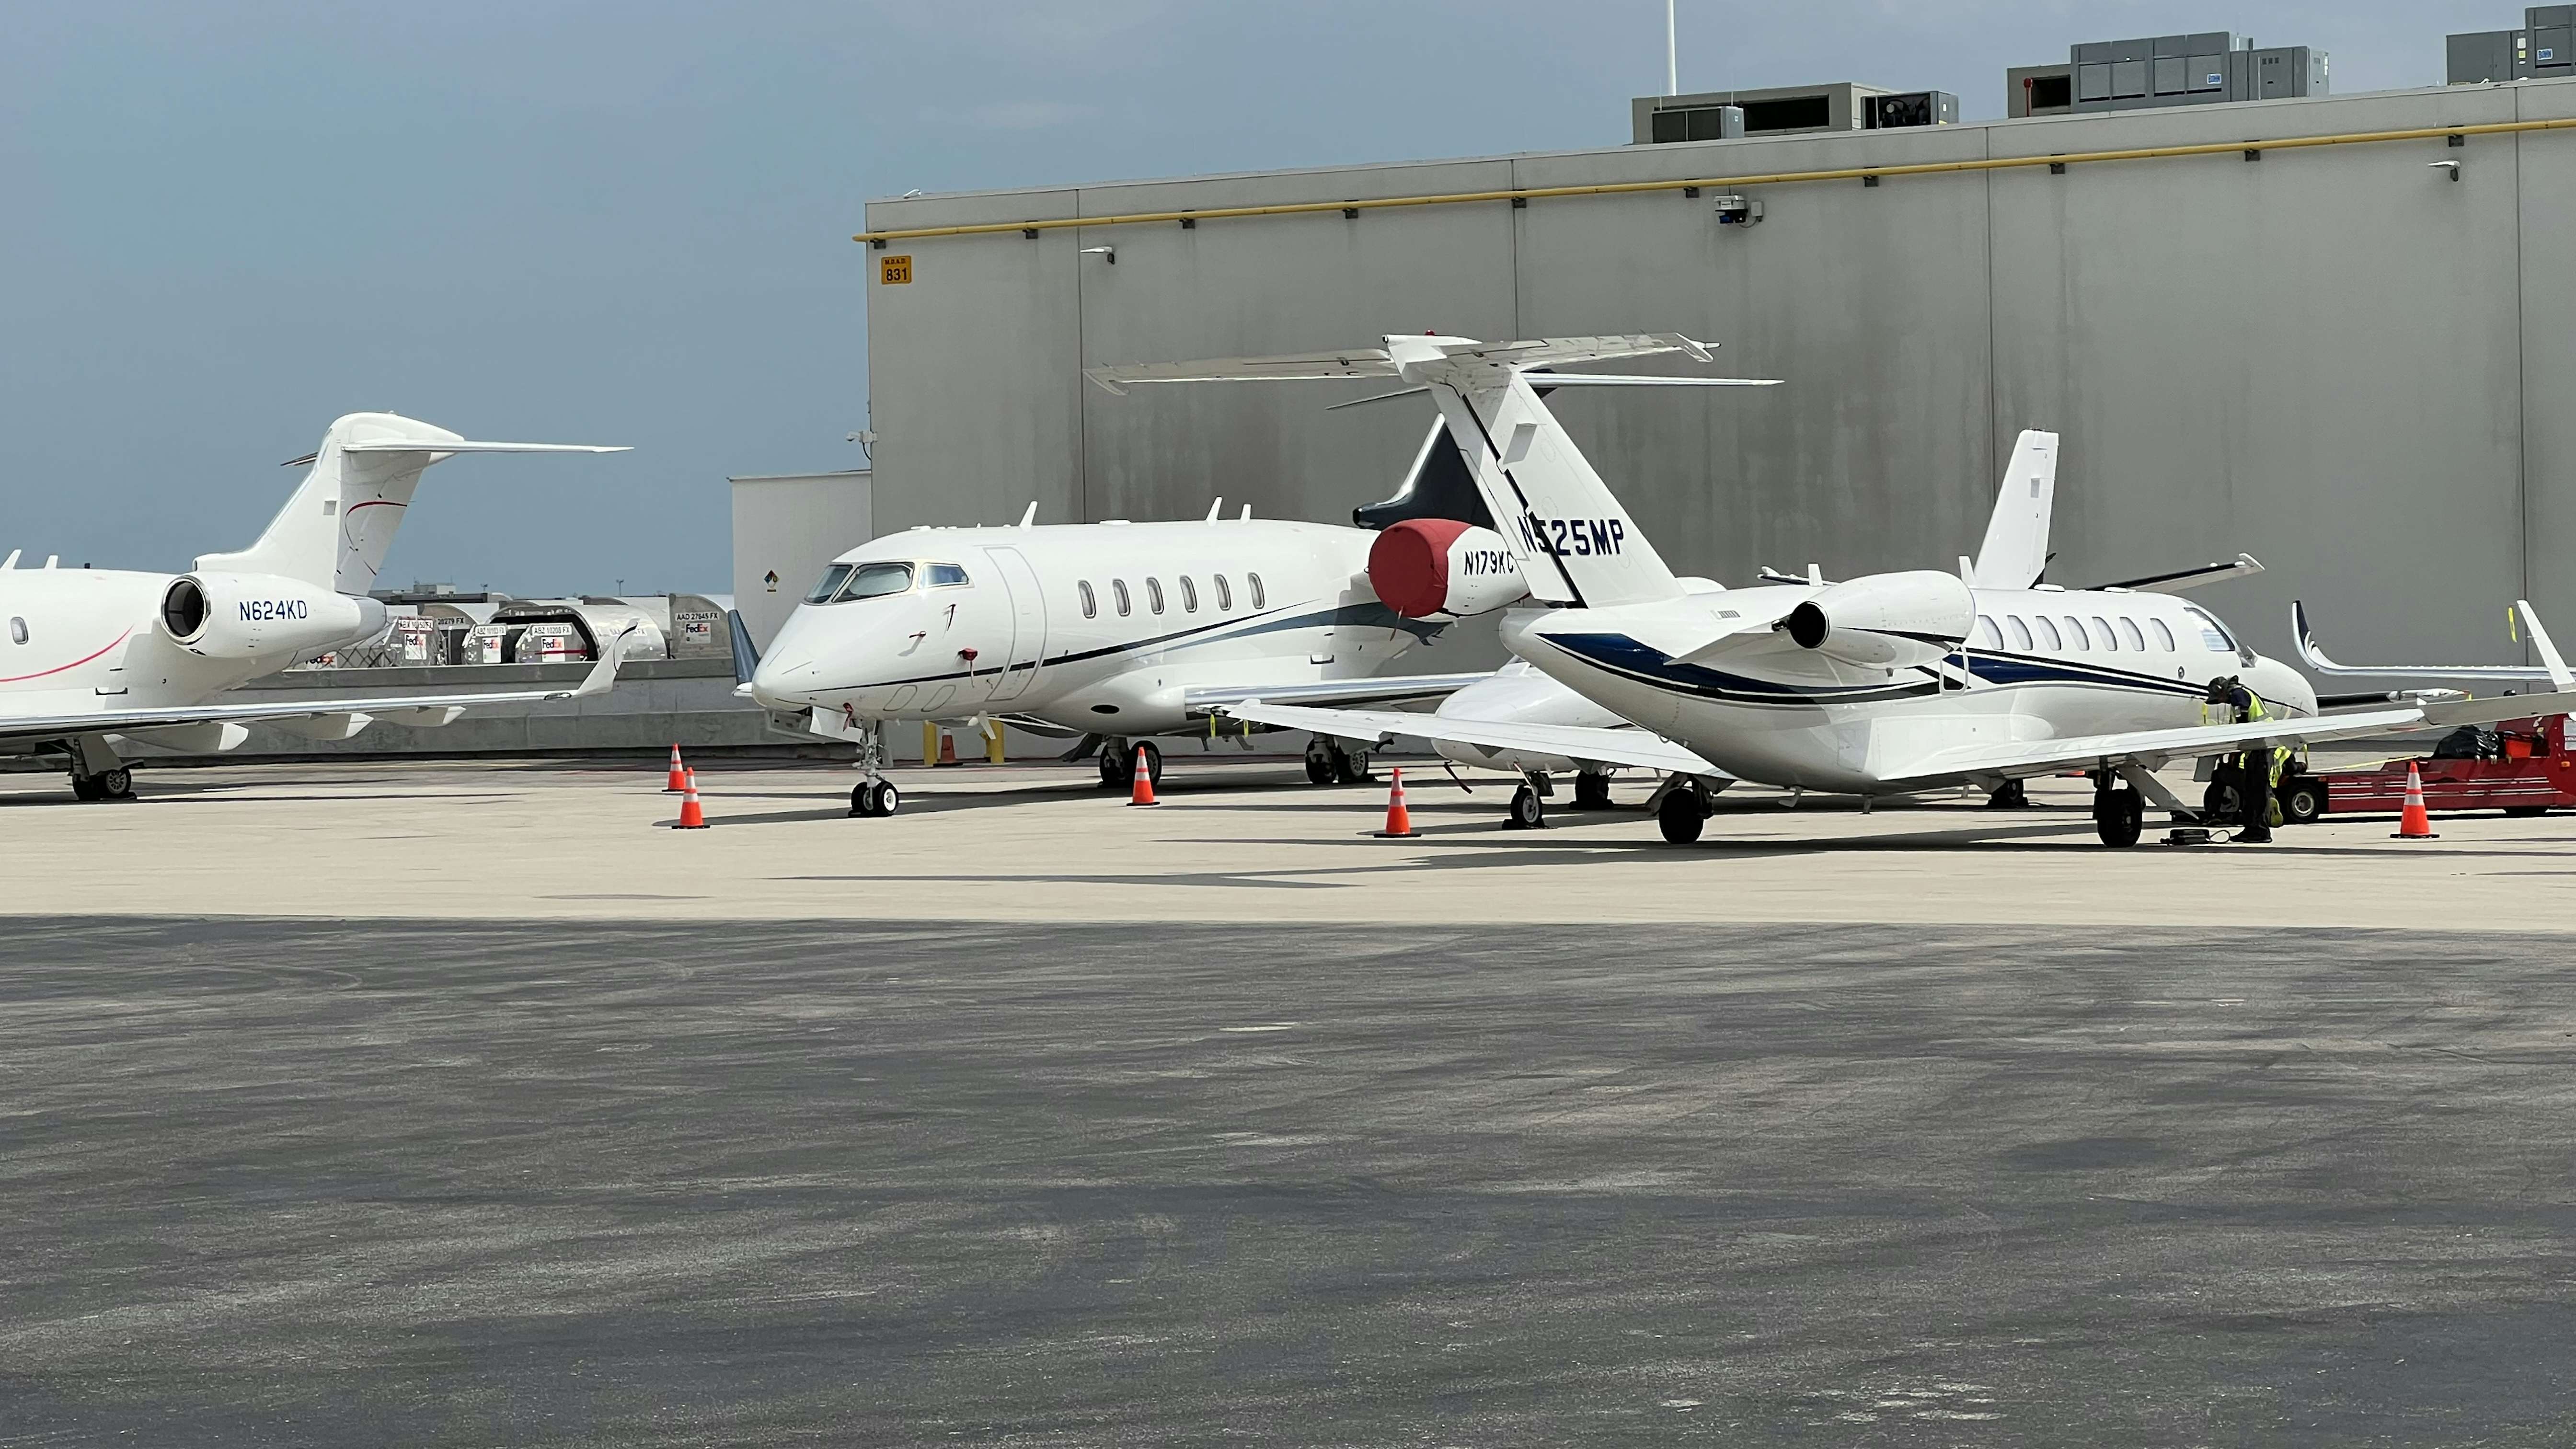
No turkeys in this week’s private jet flight activity as business aviation continues to confound the bears.

Business aviation can celebrate Thanksgiving as the latest WingX weekly tracking report shows global private jet flights increased 9% week-to-week with 75,071 segments, just under the 52-week high of 76,521 segments.
The strong week was 1% above Week 46 in 2022.
According to WingX, 192,000 private jet sectors were flown 19 days into November.
That’s on par with last year and 22% ahead of four years ago.
Year-to-date, global business jet activity is down by 4% compared to 2022.
That still puts it 19% ahead of 2019.
Meanwhile, scheduled airline activity trails November 2019 by 9%.
In the U.S., the F1 in Las Vegas drew 927 private jet arrivals. Two-thirds (67%) were flights of less than 90 minutes, and 131 were from Van Nuys Airport in Los Angeles.
The U.S. saw 10% week-to-week growth with 55,178 segments.
California and Texas private flights were 5% ahead of Week 46 last year.
Meanwhile, Europe (9,147 segments) saw a 2% week-to-week increase, 4% under 2022.
| Market | Week 46 | %Change vs. prior week | % Change vs 2022 | 52-week high | Week | 52-week low | Week | Last 4 Weeks | %Change vs. 2022 |
| Global | 75,071 | 9% | 1% | 76,521 | W26 2023 | 57,233 | W51 2022 | 280,343 | -1% |
| North America | 60,279 | 10% | 2% | 60,279 | W46 2023 | 41,108 | W27 2023 | 221,695 | -1% |
| USA | 55,178 | 10% | 1% | 55,178 | W46 2023 | 37,073 | W27 2023 | 203,990 | -1% |
| Florida | 7,604 | 13% | 0% | 9,174 | W8 2023 | 3,628 | W35 2023 | 26,895 | 1% |
| California | 5,658 | 17% | 5% | 5,658 | W46 2023 | 3,463 | W27 2023 | 19,554 | -2% |
| Texas | 6,036 | 10% | 5% | 6,036 | W46 2023 | 3,335 | W27 2023 | 21,624 | -3% |
| Europe | 9,147 | 2% | -4% | 16,289 | W26 2023 | 6,648 | W52 2022 | 36,498 | -9% |
| UK | 1,190 | -6% | -17% | 2,014 | W28 2023 | 982 | W52 2022 | 5,021 | -14% |
| Germany | 1,334 | 4% | -4% | 1,623 | W24 2023 | 651 | W52 2022 | 4,784 | -12% |
| France | 1,213 | -4% | -4% | 2,653 | W26 2023 | 1,011 | W52 2022 | 4,910 | -9% |
| Switzerland | 620 | 12% | -1% | 1,039 | W3 2023 | 549 | W47 2022 | 2,302 | -11% |
| Italy | 841 | 2% | 2% | 2,264 | W28 2023 | 511 | W52 2022 | 3,516 | -2% |
| Middle East | 1,300 | -5% | -7% | 2,173 | W50 2022 | 984 | W52 2022 | 5,547 | -7% |
| Africa | 865 | 7% | 7% | 987 | W17 2023 | 622 | W2 2023 | 3,228 | -1% |
| Asia | 2,513 | 1% | -7% | 3,269 | W50 2022 | 1,913 | W27 2023 | 9,977 | 1% |
| South America | 1,521 | 0% | 26% | 1,498 | W32 2023 | 1154 | W47 2022 | 6,142 | 25% |
Source: WingX for Private Jet Card Comparisons. Includes Jets and VIP Airliners.
Fractional and charter operators (37,523 segments) enjoyed an 8% bump from the previous week, 1% more than last year.
U.S. fractional and charter activity (28,235 flights) was 2% up compared to 2022.
The biggest U.S. markets (Florida, California, and Texas) were busier than a year ago.
| Market (Part 91K & Part135) | Week 46 | % Change vs. prior wk | %Change vs. 2022 | 52-week high | Week | 52-week low | Week | Last 4 Weeks | %Change vs. 2022 |
| Global | 37,253 | 8% | 1% | 40,375 | W26 2023 | 31,174 | W51 2022 | 141,325 | -1% |
| North America | 29,172 | 8% | 2% | 30,412 | W52 2022 | 21,649 | W27 2023 | 110,572 | 0% |
| USA | 28,235 | 10% | 2% | 28,235 | W46 2023 | 20,505 | W27 2023 | 105,784 | 1% |
| Florida | 4,284 | 13% | 1% | 5,792 | W52 2022 | 1,958 | W35 2023 | 15,374 | 2% |
| California | 3,480 | 18% | 5% | 3,480 | W46 2023 | 2,253 | W27 2023 | 12,139 | -2% |
| Texas | 2,496 | 5% | 3% | 2,496 | W46 2023 | 1,404 | W27 2023 | 9,163 | -3% |
| Europe | 6,562 | 1% | -3% | 12,171 | W27 2023 | 4,995 | W52 2022 | 26,721 | -6% |
| UK | 844 | -11% | -16% | 1,516 | W28 2023 | 735 | W2 2023 | 3,718 | -10% |
| Germany | 925 | 3% | -5% | 1,223 | W37 2022 | 516 | W52 2022 | 3,414 | -10% |
| France | 845 | -3% | -5% | 1,943 | W27 2023 | 764 | W52 2022 | 3,492 | -9% |
| Switzerland | 454 | 7% | -1% | 776 | W7 2023 | 415 | W47 2022 | 1,723 | -10% |
| Italy | 687 | 5% | 10% | 1,847 | W28 2023 | 389 | W52 2022 | 2,870 | 6% |
| Middle East | 660 | -5% | -8% | 1,075 | W50 2022 | 512 | W52 2022 | 2,957 | -7% |
| Africa | 267 | 9% | 0% | 341 | W17 2023 | 180 | W04 2023 | 1,029 | -12% |
| Asia | 653 | 0% | 0% | 1,015 | W50 2022 | 443 | W31 2023 | 2,748 | 5% |
| South America | 48 | 0% | -14% | 66 | W52 2022 | 18 | W22 2023 | 208 | 20% |
Source: WingX for Private Jet Card Comparisons. Includes Jets and VIP Airliners.
Over the past four weeks, U.S. charter and fractional activity (105,784 flights) was up 1% compared to last year.
The failure of private jet activity to dive, as some predicted, is backed up by The Jet Card Report by Private Jet Card Comparisons.
The report focuses on consumers who fly by jet cards, memberships, fractional ownership, and on-demand charters.
95.1% of those who started flying after the pandemic say they are sticking with it.
At the same time, 53.0% of private flyers who were active before the pandemic say they continue to fly at the same levels, with 33.5% saying their use of private jets is increasing.
Only 13.6% are flying less, according to Private Jet Card Comparisons subscribers.
That’s despite hourly charter prices increasing by 24% since December 2020.