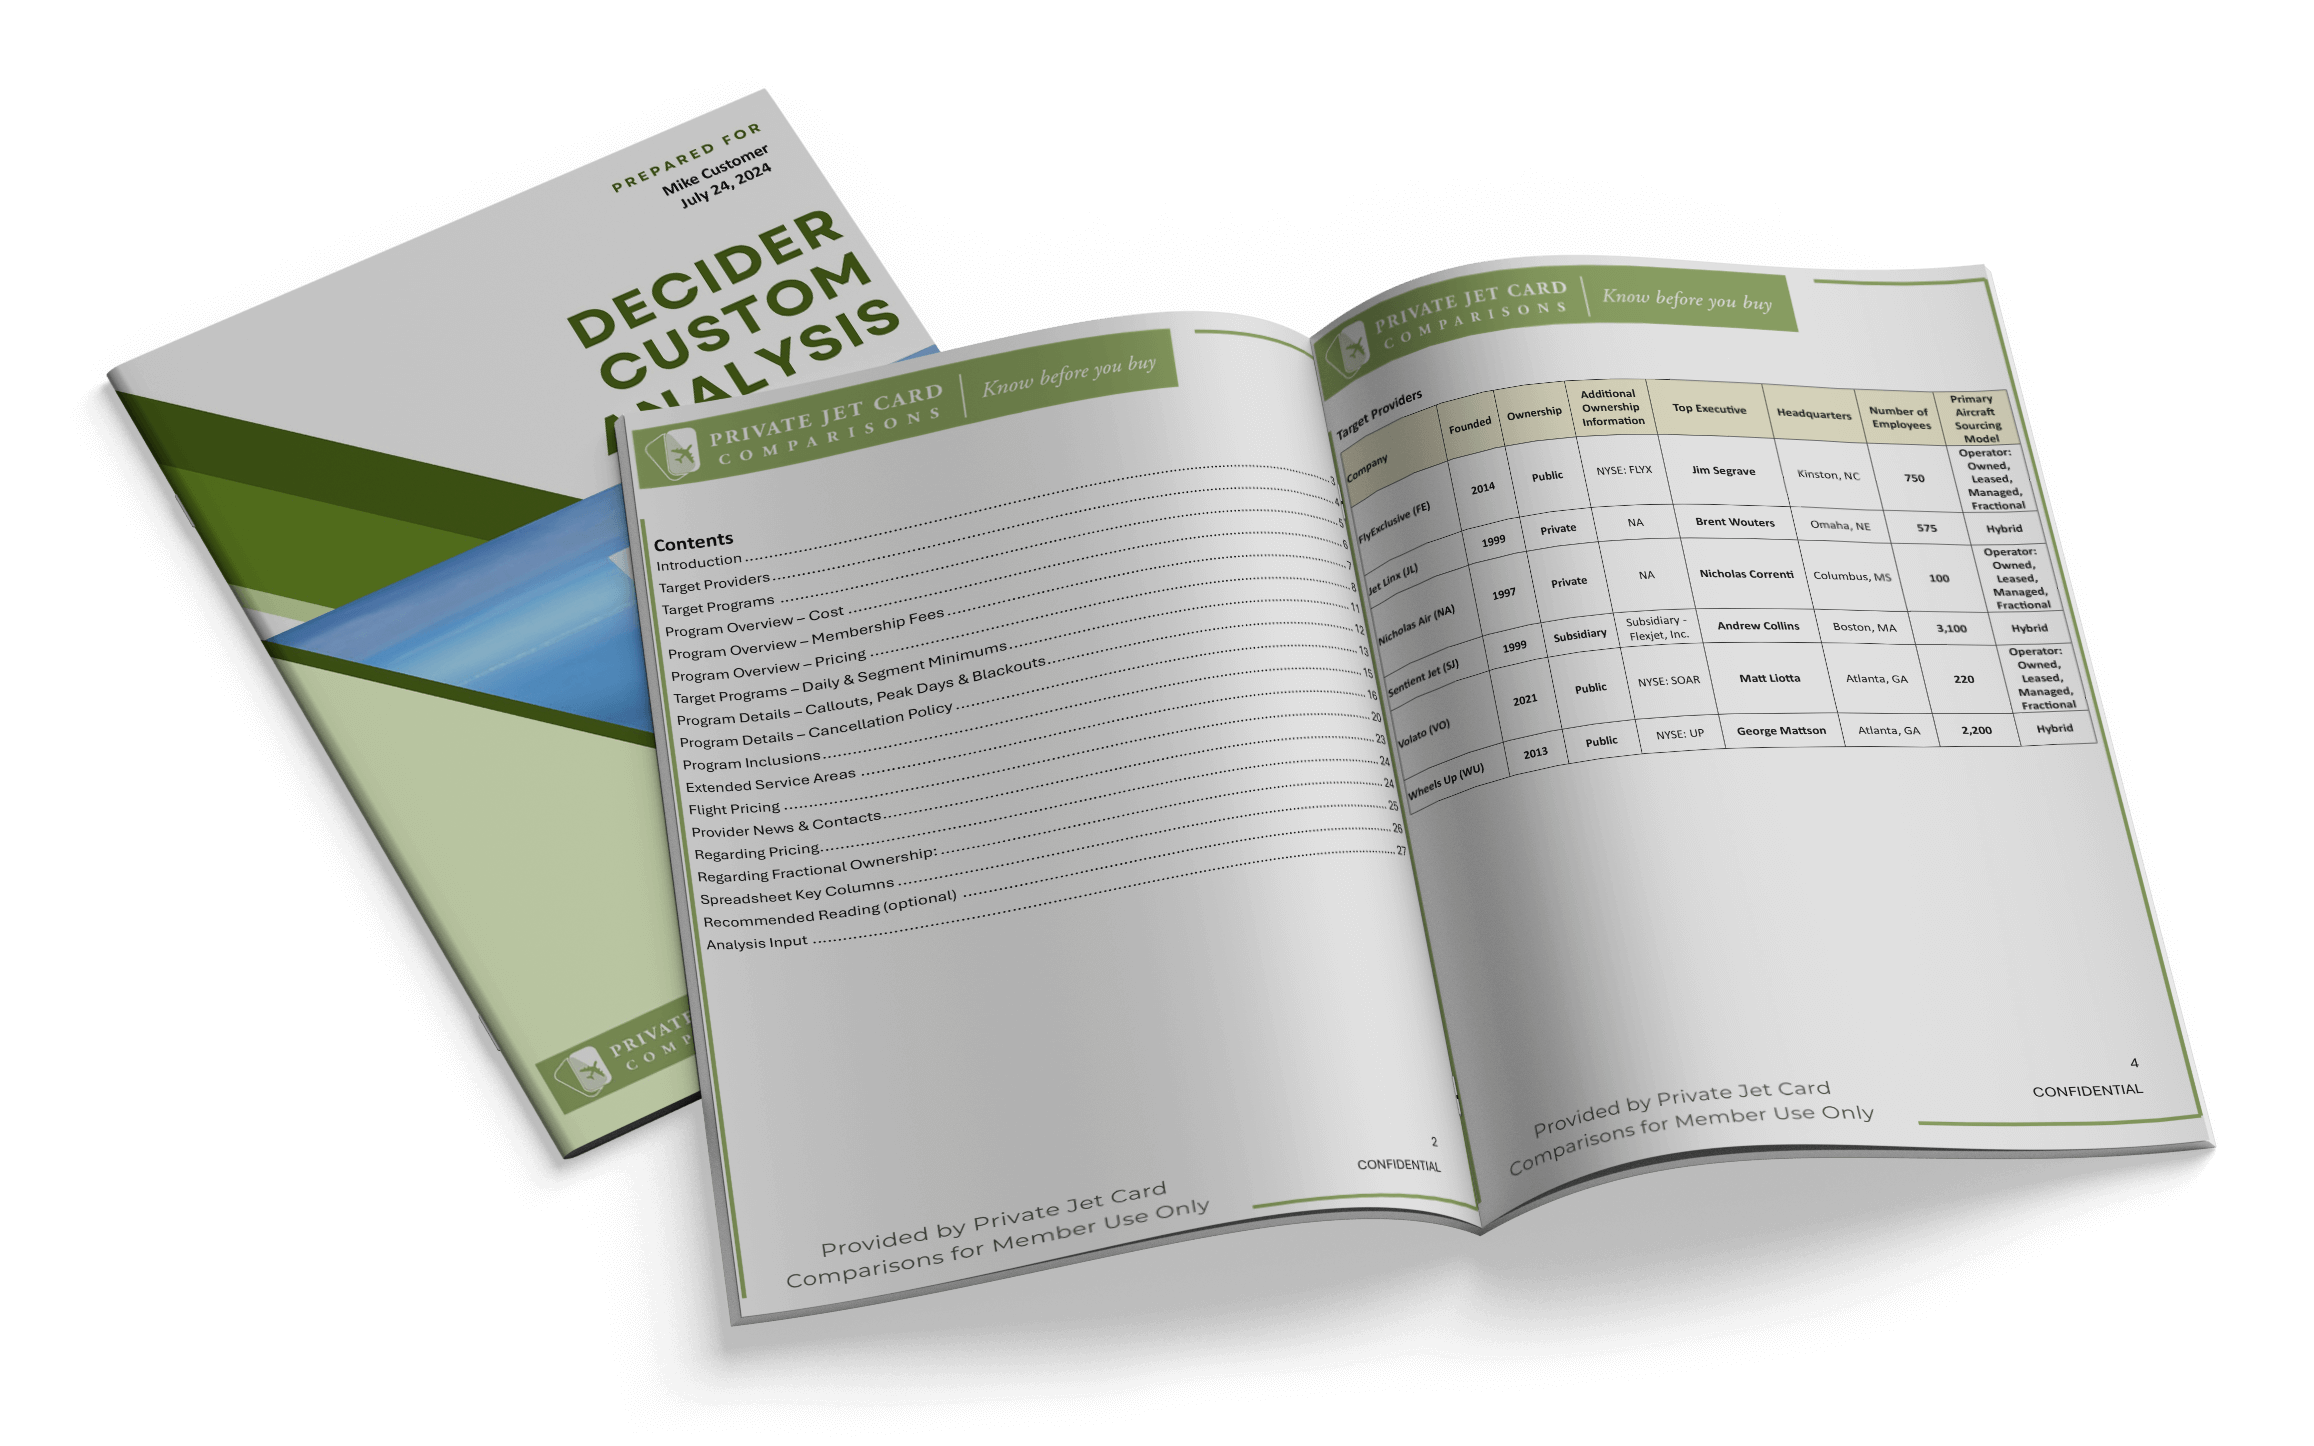
The average hourly rate for guaranteed jet cards dipped 1% in Q2 compared to Q1 2026, according to the latest analysis by Private Jet Card Comparisons.
Hourly jet card rates were up 0.4% year-over-year compared to the second quarter of 2025.
At the same time, the average number of peak days was up 25.2%.
Q1 2026 Jet Card Pricing
North American jet card rates overall averaged $11,314 per hour at the end of Q2 2026.
Without turboprops, the average hourly rate for jet cards was $11,688.
Included are jet cards with guaranteed availability and rates.
Hourly pricing includes base rate, fuel surcharges, and 7.5% Federal Excise Tax.
The Private Jet Card Comparisons database comprises over 80 providers and more than 1,000 options.
There were 44 updates to the Private Jet Card Comparisons database during the quarter.
That compares to 115 in Q1 of 2026, 45 in Q4 of 2025, 41 in Q3, and 33 updates in Q2.
The analysis focuses on entry-level jet cards, defined as those with fewer than 50 hours.
Some of the quarter-to-quarter changes were affected by three sellers withdrawing from the jet card market.
Jetvia eliminated its guaranteed jet card program.
Wheels Up ended its legacy program.
Jettly stopped selling its 25-hour jet card product.
This analysis compared jet card products with fewer than 50 hours.
Comparison 2026 vs. 2025 and 2019
The average hourly jet card rate by aircraft category at the end of Q2 2026 compared to Q1 of 2026, Q2 2025, and Q4 2019, was:
- Turboprops at $6,271 per hour, down 6.8% from Q1 2026, down 4.8% from Q2 2025, and up 31.7% from pre-COVID Q4 2019
- Very Light Jets at $7,688 per hour, down 2.1% from Q1 2026, up 1.1% from Q2 2025, and up 36.0% from pre-COVID Q4 2019
- Light Jets at $8,456 per hour, down 1.2% from Q1 2026, up 1.3% from Q2 2025, and up 40.4% from pre-COVID Q4 2019
- Midsize Jets at $9,557 per hour, down 0.8% from Q1 2026, down 2.6% from Q2 2025, and up 26.9% from pre-COVID Q4 2019
- Super Midsize Jets at $12,526 per hour, up 0.7% from Q1 2026, up 0.5% from Q2 2025, and up 24.7% from pre-COVID Q4 2019
- Large Cabin Jets at $15,236 per hour, down 2.4% from Q1 2026, up 0.5% from Q2 2025, and up 16.9% from pre-COVID Q4 2019
- Ultra Long Haul Jets at $19,202 per hour, down 0.5% from Q1 2026, up 0.9% from Q2 2025, and up 14.1% from pre-COVID Q4 2019
- Overall Jet Card Rates at $11,314 per hour, down 1.0% from Q1 2026, up 0.6% from Q2 2025, and up 27.1% from pre-COVID Q4 2019
The hourly rates are based on published rates and do not account for the constant flow of jet card deals.
The deals are generally valued in the mid-single digits in terms of added value.
Jet Card Hourly Rates (2019 to Q2 2026)
| HOURLY RATES |
2019.Q4 |
2020.Q4 |
2021.Q4 |
2022.Q4 |
2023.Q4 |
2024.Q4 |
2025.Q2 |
2025.Q4 |
2026.Q1 |
2026.Q2 |
| Turboprop |
4,762 |
4,454 |
5,982 |
7,348 |
6,269 |
6,647 |
6,584 |
6,625 |
6,729 |
6,271 |
| Very Light |
5,653 |
5,102 |
6,724 |
8,379 |
7,298 |
7,742 |
7,604 |
7,604 |
7,852 |
7,688 |
| Light |
6,023 |
5,600 |
6,978 |
8,462 |
7,918 |
8,079 |
8,344 |
8,320 |
8,563 |
8,456 |
| Midsize |
7,531 |
6,961 |
7,985 |
9,806 |
9,168 |
9,526 |
9,818 |
9,577 |
9,639 |
9,557 |
| Super Midsize |
10,042 |
9,190 |
10,570 |
12,675 |
11,793 |
12,333 |
12,467 |
12,317 |
12,444 |
12,526 |
| Large |
13,033 |
12,109 |
13,229 |
16,108 |
15,339 |
15,209 |
15,168 |
15,264 |
15,612 |
15,236 |
| Ultra-Long-Haul |
16,834 |
15,316 |
17,339 |
20,646 |
18,753 |
18,951 |
19,028 |
19,208 |
19,301 |
19,202 |
| Overall |
8,860 |
8,405 |
9,706 |
11,748 |
10,754 |
11,052 |
11,273 |
11,244 |
11,426 |
11,314 |
| Without Turboprops |
9,193 |
8,631 |
9,850 |
11,955 |
11,030 |
11,377 |
11,616 |
11,578 |
11,802 |
11,688 |
Source: Private Jet Card Comparisons
Overall, jet card hourly rates were down 1.0% sequentially from the first quarter of 2026.
Year-over-year jet card rates inceased 0.4%.
Overall, jet card rates are 27.7% higher than Q4 2019 pre-COVID.
Jet Card Rate Change (2019 to Q2 2026)
| HOURLY RATES |
Change from Q1 2026 |
Change from Q4 2025 |
Change from Q2 2025 |
Change from Q4 2024 |
Change from Q4 2023 |
Change from Q4 2022 |
Change from Q4 2021 |
Change from Q4 2020 |
Change from Q4 2019 |
| Turboprop |
-6.8% |
-5.3% |
-4.8% |
-5.7% |
0.0% |
-14.7% |
4.8% |
40.8% |
31.7% |
| Very Light |
-2.1% |
1.1% |
1.1% |
-0.7% |
5.3% |
-8.2% |
14.3% |
50.7% |
36.0% |
| Light |
-1.2% |
1.6% |
1.3% |
4.7% |
6.8% |
-0.1% |
21.2% |
51.0% |
40.4% |
| Midsize |
-0.8% |
-0.2% |
-2.6% |
0.3% |
4.2% |
-2.5% |
19.7% |
37.3% |
26.9% |
| Super Midsize |
0.7% |
1.7% |
0.5% |
1.6% |
6.2% |
-1.2% |
18.5% |
36.3% |
24.7% |
| Large |
-2.4% |
-0.2% |
0.5% |
0.2% |
-0.7% |
-5.4% |
15.2% |
25.8% |
16.9% |
| Ultra-Long-Haul |
-0.5% |
0.0% |
0.9% |
1.3% |
2.4% |
-7.0% |
10.7% |
25.4% |
14.1% |
| Overall |
-1.0% |
0.6% |
0.4% |
2.4% |
5.2% |
-3.7% |
16.6% |
34.6% |
27.7% |
| Without Turboprops |
-1.0% |
1.0% |
0.6% |
2.7% |
6.0% |
-2.2% |
18.7% |
35.4% |
27.1% |
Source: Private Jet Card Comparisons
Super Midsize Jets (+0.7%) were the only category with a quarter-to-quarter increase.
Light Jets (+1.4%) and Very Light Jets (+1.1%) saw their largest year-over-year percentage increases in Q2 2026 compared to Q2 2025.
Daily Minimums
Daily Minimums decreased quarter-to-quarter from 96.1 to 92.9 minutes.
Year-over-year daily minimums increased from 83.7 minutes to 92.9 minutes.
Before COVID in 2019, the overall average daily minimum was 86.2 minutes.
Daily Minimums (2019 to Q2 2026)
| DAILY MINIMUMS (minutes) |
2019.Q4 |
2020.Q4 |
2021.Q4 |
2022.Q4 |
2023.Q4 |
2024.Q4 |
2025.Q2 |
2025.Q4 |
2026.Q1 |
2026.Q2 |
| Light |
78.1 |
79.5 |
87.9 |
75.8 |
71.9 |
68.7 |
69.8 |
72.0 |
79.9 |
72.8 |
| Midsize |
83.7 |
84.1 |
95.8 |
83.0 |
79.7 |
77.3 |
77.7 |
81.1 |
92.8 |
91.6 |
| Super Midsize |
95.7 |
95.3 |
111.5 |
94.1 |
96.5 |
92.9 |
88.8 |
92.4 |
100.6 |
101.8 |
| Large |
101.4 |
98.6 |
125.6 |
110.2 |
121.4 |
121.8 |
109.4 |
109.4 |
117.2 |
116.8 |
| Overall |
86.2 |
85.4 |
103.3 |
94.7 |
89.4 |
86.7 |
83.7 |
86.1 |
96.1 |
92.9 |
Source: Private Jet Card Comparisons
Super Midsize jets saw an average daily minimum increase from 100.6 to 101.8 minutes sequentially.
It was the only category to see an increase.
Light jet daily minimums decreased from 79.9 minutes to 72.8 minutes quarter-to-quarter.
That was the biggest decrease.
Daily Minimums (2019 to Q2 2026)
| DAILY MINIMUMS (minutes) |
Change from Q1 2026 |
Change from Q4 2025 |
Change from Q2 2025 |
Change from Q4 2024 |
Change from Q4 2023 |
Change from Q4 2022 |
Change from Q4 2021 |
Change from Q4 2020 |
Change from Q4 2019 |
| Light |
-8.9% |
1.1% |
4.3% |
6.0% |
1.3% |
-3.9% |
-17.2% |
-8.4% |
-6.8% |
| Midsize |
-1.3% |
13.0% |
17.9% |
18.5% |
14.9% |
10.4% |
-4.4% |
8.9% |
9.4% |
| Super Midsize |
1.2% |
10.2% |
14.6% |
9.6% |
5.5% |
8.2% |
-8.7% |
6.8% |
6.4% |
| Large |
-0.4% |
6.8% |
6.8% |
-4.1% |
-3.8% |
6.0% |
-7.0% |
18.5% |
15.2% |
| Overall |
-3.4% |
7.8% |
10.9% |
7.2% |
3.9% |
-1.9% |
-10.1% |
8.8% |
7.8% |
Source: Private Jet Card Comparisons
Overall daily minimums decreased 3.4% sequentially, but were 10.9% higher year-over-year.
Peak Days
The number of peak days increased to an average of 45.4 from 36.3 days at the end of Q1.
The large jump was driven by a perfect storm of programs increasing peak days, new programs with significant peak days, and the exit of several programs with few peak days.
That was up from 35.6 days in Q2 of 2025.
If we had excluded the discontinued low-peak day programs from our Q1 analysis, the average would have been 44.0 peak days instead of 36.3.
Jet Card Peak Days (2019 to Q2 2026)
| PEAK DAYS |
2019 Q4 |
2020 Q4 |
2021 Q4 |
2022 Q4 |
2023 Q4 |
2024 Q4 |
2025 Q2 |
2025 Q4 |
2026 Q1 |
2026 Q2 |
| Days |
22.8 |
24.4 |
39.3 |
55.7 |
47.4 |
44.6 |
35.6 |
35.6 |
36.3 |
45.4 |
Source: Private Jet Card Comparisons
Peak days increased 25.2% sequentially.
The number of peak dates was up 27.5% year over year compared to Q2 2025.
Jet Card Peak Days (2019 to Q2 2026)
| PEAK DAYS |
Change from Q1 2026 |
Change from Q4 2025 |
Change from Q2 2025 |
Change from Q4 2024 |
Change from Q4 2023 |
Change from Q4 2022 |
Change from Q4 2021 |
Change from Q4 2020 |
Change from Q4 2019 |
| Days Change |
25.2% |
27.5% |
27.5% |
1.9% |
-4.2% |
-18.4% |
15.5% |
86.1% |
99.1% |
Source: Private Jet Card Comparisons
Compared to pre-COVID, peak days are currently 99.1% higher.
Back in Q4 2019, the average program had just 22.8 peak days.
Jet Card Callouts
The lead time to book guaranteed rates decreased slightly.
The non-peak callout decreased from 66.9 hours to 65.9 hours for non-peak bookings quarter-to-quarter.
Year-over-year callout increased from 63.2 hours to 65.9 hours.
Jet Card Callouts (2019 to Q2 2026)
| CALL OUTS |
2019 Q4 |
2020 Q4 |
2021 Q4 |
2022 Q4 |
2023 Q4 |
2024 Q4 |
2025 Q2 |
2025 Q4 |
2026 Q1 |
2026 Q2 |
| Hours |
23.2 |
29.0 |
55.9 |
64.7 |
69.3 |
66.2 |
63.2 |
62.5 |
66.9 |
65.9 |
Source: Private Jet Card Comparisons
Pre-COVID, the average callout was 23.2 hours.
Jet Card Callouts (2019 to Q2 2026)
| CALL OUTS |
Change from Q1 2026 |
Change from Q4 2025 |
Change from Q2 2025 |
Change from Q4 2024 |
Change from Q4 2023 |
Change from Q4 2022 |
Change from Q4 2021 |
Change from Q4 2020 |
Change from Q4 2019 |
| Hours Change |
-1.5% |
5.5% |
4.3% |
-0.5% |
-4.9% |
1.9% |
17.9% |
127.2% |
184.1% |
Source: Private Jet Card Comparisons
The average callout was 1.5% shorter at the end of Q2 2026 compared to Q1 of this year.
Year-over-year, it increased 4.3%.