Wheels Up Experience Inc. will release its first-quarter 2026 financial results on Monday, May 11, 2026.
The company has recently been busy with finance, fleet, and management moves.
Last month, it completed a 20-to-1 stock split.
The move puts it back in compliance with New York Stock Exchange standards.
UP opens this morning at $5.60.
Its current market cap is $202.8 million.
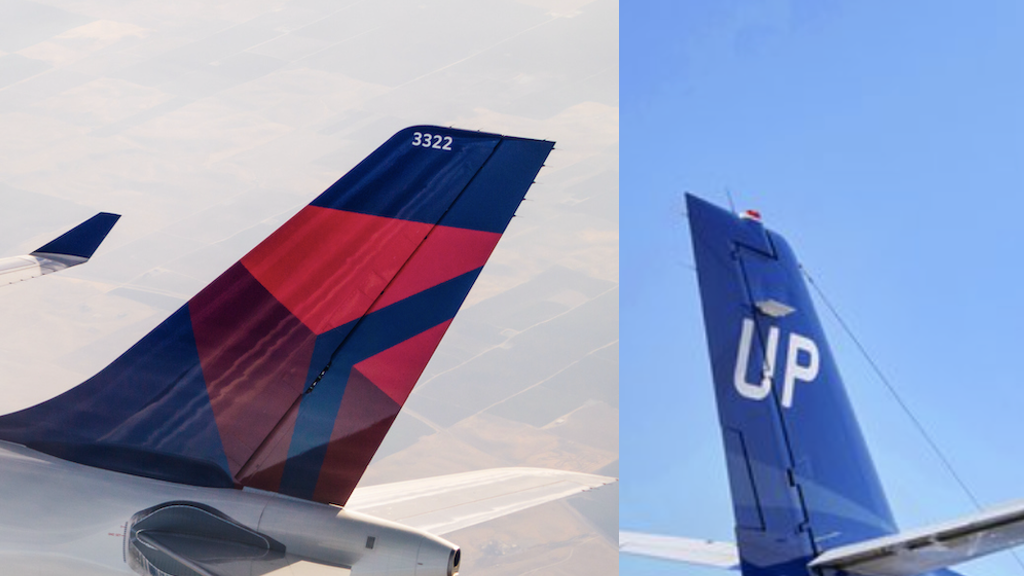
The Delta Air Lines-backed private jet company also removed from service the last of its legacy jet fleet.
Back in March, it announced plans to double its fleet of more modern Embraer and Bombardier aircraft.
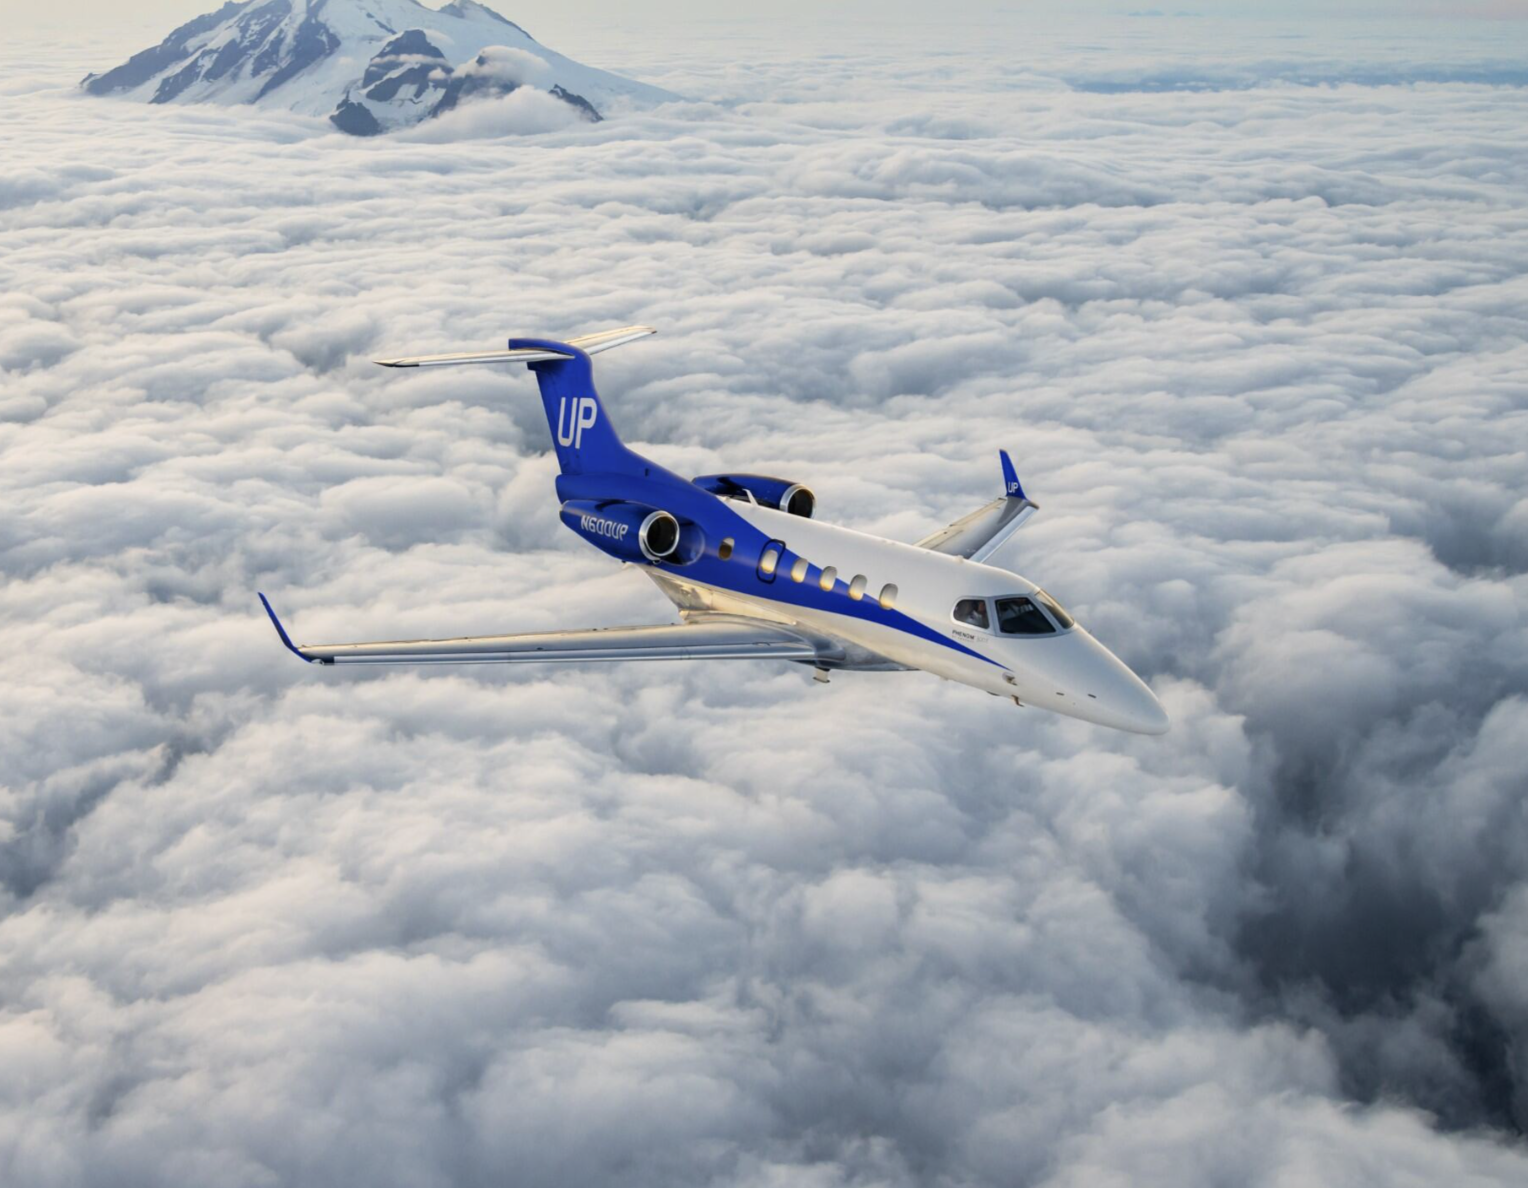
The Phenom 300s and Challenger 300s replace older Hawker light jets, Citation Excel, and Citation X.
According to the most recent FAA update, the fleet currently consists of 80 aircraft.
Phenoms increased from 18 to 25, making them the largest type.
Challengers increased from four to 10.
Its King Air 350 fleet dropped from 31 to 14.
Wheels Up ended 2025 ranked fourth among U.S. private jet companies based on charter and fractional flight hours.
It also announced former Tiffany and Ralph Lauren top executive Roger Farah would be joining its board of directors.
It will also be seeking to show financial progress.
Below is a recap of its Q4 2025 and full-year 2025 results.
Wheels Up Q4 2025 Financials
Adjusted EBITDA in Q4 2025 was $32.9 million, a year-over-year improvement from an $11.3 million loss in Q4 2024.
Adjusted EBITDAR was a positive $36.9 million compared to a $3.2 million loss in 2024.
It was also a quarter-to-quarter improvement over the $23.2 million EBITDA loss in Q3 2025 and a negative $19.7 million EBITDAR.
The company said numbers were held back by “transitory inefficiencies associated with fleet modernization,” which brought down the adjusted contribution margin by 3.5 points in the most recent quarter.
Wheels Up Quarterly financials (Last 5 quarters)
| (in millions) |
Q4 2024 |
Q1 2025 |
Q2 2025 |
Q3 2025 |
Q4 2025 |
| TTL Gross Bookings $ |
314.0 |
214.9 |
261.9 |
266.6 |
269.0 |
| Block Sales $ |
190.0 |
133.0 |
127.0 |
127.0 |
188.0 |
| Revenue $ |
204.8 |
177.5 |
189.6 |
185.4 |
183.8 |
| Gross profit (loss) $ |
15.5 |
(1.1) |
2.2 |
(1.3) |
12.8 |
| Adjusted Contribution $ |
39.6 |
22.4 |
23.7 |
23.5 |
35.0 |
| Adjusted Contribution Margin |
19.3% |
12.6% |
12.2% |
12.7% |
19.1% |
| Net loss $ |
(87.5) |
(99.3) |
(82.3) |
(83.7) |
(28.9) |
| Adjusted EBITDA $ |
(11.3) |
(24.2) |
(29.0) |
(23.2) |
32.9 |
| Adjusted EBITDAR $ |
NA |
(18.8) |
(25.1) |
(19.7) |
36.9 |
Source: Wheels Up
Gross profit, $12.6 million for the year, compared to $2.5 million in 2024, was negatively impacted by about $9 million for the same reason, according to the press release.
Wheels Up posted a 67% reduction in net loss, from $87.5 million in Q4 2024 to $28.9 million in Q4 2025.
The Q3 2025 net loss was $83.7 million.
Wheels Up attributed the smaller net loss to a “stronger mix of profitable membership and charter flying, exit of unprofitable fleets, early progress toward its $70 million annual run-rate cost reduction target, and one-time gains from aircraft sale-leaseback transactions.”
The December sale-leaseback agreement covered three Challenger 300s and seven Phenom 300s, raising $105 million.
At the time, the Delta Air Lines-backed private aviation company said it would use $65 million to pay debt from its revolving equipment notes facility.
The remainder, $40 million, would be added to the company’s balance sheet.
Full-year net loss dropped from $339.6 million in 2024 to $294.2 million last year.
Operating loss decreased by 21% to $203.4 million.
Adjusted EBITDA loss declined from $117.9 million in 2024 to $43.5 million in 2025.
Adjusted EBITDAR loss fell to $26.7 million from $84.6 million year-over-year.
Wheels Up Full Year Financials (2018 to 2015)
| (in millions) |
2018 |
2019 |
2020 |
2021 |
2022 |
2023 |
2024 |
2025 |
| Total Gross Bookings $ |
NA |
NA |
NA |
NA |
NA |
NA |
1,043.8 |
1,039.5 |
| Block Sales $ |
NA |
NA |
530.0 |
897.0 |
1,005.0 |
482.0 |
595.0 |
576.0 |
| Total Revenue $ |
332.0 |
385.0 |
695.0 |
1,194.3 |
1,579.8 |
1,253.3 |
792.1 |
736.5 |
| Gross profit (loss) $ |
14.0 |
5.0 |
1.7 |
22.4 |
(26.5) |
(37.7) |
2.5 |
12.6 |
| Adjusted Contribution $ |
49.0 |
44.0 |
62.4 |
82.2 |
57.9 |
62.5 |
85.7 |
104.1 |
| Adjusted Contribution Margin |
14.7% |
11.5% |
9.0% |
6.9% |
3.7% |
5.0% |
10.8% |
14.1% |
| Net loss $ |
(83.0) |
(107.0) |
(85.4) |
(197.2) |
(555.5) |
(487.4) |
(339.6) |
(294.2) |
| Adjusted EBITDA $ |
(14.0) |
(21.0) |
(52.4) |
(87.4) |
(185.3) |
(145.9) |
(117.9) |
(43.5) |
| Adjusted EBITDAR $ |
NA |
NA |
NA |
NA |
NA |
NA |
NA |
(26.6) |
Source: Wheels Up
Wheels Up ended 2025 with $234 million in liquidity.
That includes $134 million of cash and cash equivalents and an undrawn $100 million Delta revolving credit facility.
There was $739.4 million in deferred revenue, down from $749.5 million the year before.
Deferred revenue included prepaid funds for future flights.